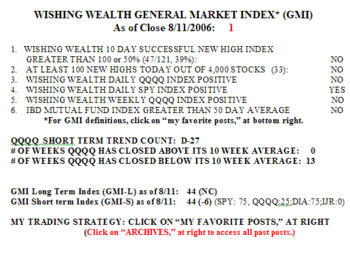
"While driving to work Thursday, I opined that when the Today Show producers are so sure of the bull trend that they invite Cramer to appear and declare that the current bull market is like that of the 1920’s, this was a big indication of a market nearing its top. Katie missed the opportunity to remind him how the bull market of the 1920’s ended………………
So, the GMI weakened to +4 and the QQQQ closed below its important longer term 30 week average for the first time since last October. When a major index is below its 30 week average I get very defensive in the stocks represented by that indicator. But the QQQQ is not alone. The IJR small cap index short term indicators have weakened greatly (see the GMI-S index below) and this index ETF is now below its 30 day average, a sign of possible short term weakness. The QQQQ looks miserable and may be on the verge of a major bear market even though it did not participate much in the rise in the DIA and SPY. Only 10% of the QQQQ stocks advanced on Thursday, along with 11% of the SPY stocks and 3% of the "strong" DIA stocks. Only 51% of the 4,000 stocks in my universe closed above their 10 week moving averages. The QQQQ is now in its first day of a new short term down trend (D-1)………."
Wishing Wealth post on May 12, 2006
I wish I had been too pessimistic last May. From the end of January until that post the GMI had been mainly in the 5-6 range and never less than 4. However, after the above post the GMI fell from 4 to 1 and remained between 0 and 2 through June 30. Between July 3-6 the GMI rose to between 3-4, and then returned to 0-2 since. If you have been following my blog, you know that I have therefore been in a defensive mode all of this time. Most of my short trades since May have been profitable. With the GMI still at 1 today, there is no reason to go long. When it gets up to 4 or higher the odds of making money on the long side will be in our favor again. Patience is the sine qua non of successful trading………………. 
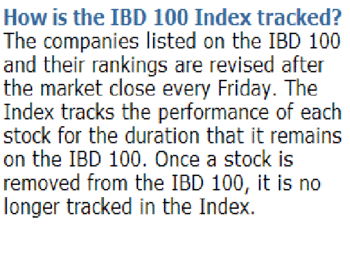
On page B4 of Monday’s IBD (8/14/2006) you will see the regularly presented comparison of the IBD 100 stocks and the S&P 500 stocks. Today it shows that that from 5/2/03 to 8/4/06, the IBD 100 stocks have gained +127.8% versus the S&P 500’s +37.6%. Sounds pretty good doesn’t it? However, note IBD’s explanation to the right, of how they compute the IBD 100 Index.  Stocks that perform poorly are removed from the index each week as the index is recalculated. Well, this is not so unreasonable, because don’t the Dow 30 and S&P 500 indexes also occasionally replace poorly performing stocks? For example, only GE remains from the stocks tracked by the original Dow Jones Industrial Average. But wait a minute, how often are stocks dropped from the IBD 100 Index? If it occurred very frequently then wouldn’t we expect the resulting index to outperform other indexes that do not replace poor performers as often? For the past few months I have been posting the performance of the IBD 100 stock list published on 5/15. I have shown that since that list was published, all but 20 of the stocks are the same or below where they closed when that list was first published; 36 of the 100 stocks have declined 20% or more. I just compared the specific stocks on today’s IBD 100 list to the list published on 5/15. Was I surprised to find that only 37 of the original 100 stocks are still on the list! In other words, in less than 3 months, IBD has replaced almost two thirds of the list with better performing stocks. Are we therefore surprised that the IBD 100 index outperforms most other indexes that do not regularly drop as a high a proportion of their component stocks?
Could mutual fund managers get away with computing their funds’ performance by counting only the stocks in their portfolios that have worked out? IBD publishes a great paper based on a winning strategy for picking stocks. We readers deserve a more accurate system for tracking the performance of the IBD 100 selections.
Hello Dr. Wish,
this is something I came across on another blog http://howardlindzon.com/?p=863
…yours is listed there as well…I´m just wondering if you know about that.
Regards,
Kevin