The GMI rose to 3 (of 6) and the GMI-R to 7 (of 10). There were 39 new highs and 21 new lows in my universe of 4,000 stocks on Tuesday. 70% of the Nasdaq 100 stocks have now closed above their 30 day averages and 94% of my 16 short term indicators for four index ETF’s (DIA, QQQQ, SPY, IJR) are now positive. The QQQQ is now in its sixth day of its short term up-trend. I have closed out my shorts and am accumulating QLD , an ultra ETF that aims to move twice as much as the QQQQ (Nasdaq 100 index)…
I am incredulous of the media pundits who claim that the recent plunge in Bear Stearn’s stock to $2.00 was sudden or unexpected. 
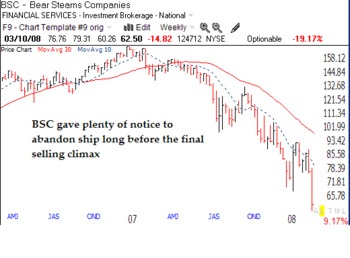
This weekly chart of BSC (click on to enlarge) shows that the stock peaked in January, 2007 and declined below its 30 week average (red line) in May, 2007, a key danger signal. A few weeks later the 10 week average (dotted line) broke below the 30 week average. Over the next five months the stock was in a sustained down-trend. In the week following the last week displayed in this chart the stock collapsed from around $60 to below $10. The ignorant media focused only on that last week of a selling climax, and missed the point that the collapse was preceded by a long six month down-trend during which anyone who follows technical analysis should have exited BSC or shorted it. (Cramer hates charts and told his audience not to exit the stock.) A story claiming sudden unexpected selling by nefarious hedge funds must sell more papers…………….