My indicators keep getting stronger. The GMI is 4 for the first time since August 20, 2008. There were more new highs than lows (22 vs. 6) in my universe of 4,000 stocks on Thursday. The Worden T2108 indicator is at 83%, the highest reading since 89% on January 6. This is typically an over-bought reading, but in July, 2003 when the market began the new bull market after the preceding bear market, the T2108 reached 93% as the new bull market got going. Thus, the current high reading may represent the burst of buying after a long bear market. Finally, the daily Guppy chart of the QQQQ suggests the beginning of a new up-trend.
All of the short term moving averages (black lines) have now crossed above the longer term averages. Tech stocks may be the new rally leaders. Keep in mind, however, that the Guppy chart of the weekly averages are still in a down-trend. For now, however, with the GMI at 4, I am taking on long positions in my IRA. A lot of present or former IBD100 stocks are showing strength (ALGT, MNRO, SNDA, TNDM, NTES). And I own a number of the stocks listed on the right.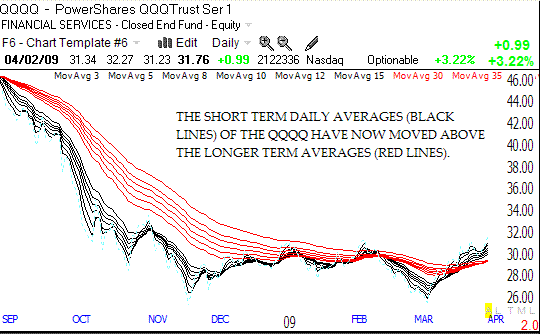
Well, your now indicators show “overbought” because everyone has been buying since jan-feb 09. Those remaining “largely in cash” have been missing the major boat! Although your indicators are not “hard-science”, I wonder if they need a little twicking to represent the current market conditions?