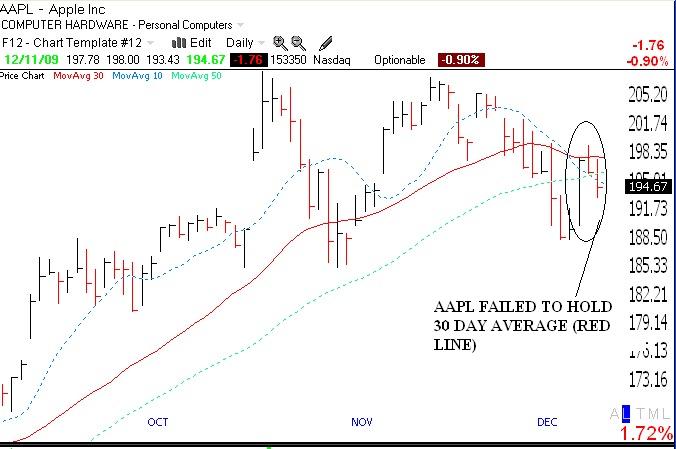
I am still concerned that AAPL (and NFLX) is showing technical weakness. On Friday, the stock could not hold its 30 day average and its 10 day average (blue dotted line) remains below its 30 day average. 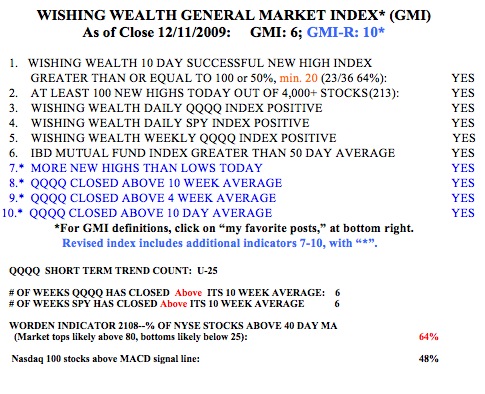 See the daily chart for AAPL below. While AAPL could always break above its 30 day this week, until it does, it may be flashing a short term down-trend. Another stock that I am short is EMS, which may also be flashing a sell signal. EMS may have formed a head and shoulders top. Nevertheless, the GMI and GMI-R are at their maximum values. So the QQQQ (Nasdaq 100 ETF) is still in short and longer term up-trends. The Worden T2108 Indicator is at 65%, in neutral territory. The daily stochastics for the QQQQ are flat and in neutral territory. So I continue to ride QLD but remain cautious, with the weakness in AAPL and NFLX.
AAPL is done, this jet is out of steam and on its way down! Isn’t it obvious for you?
I notice that your indicators are at the absolute max, while IBD says the market uptrend is “under pressure” due to all the distribution days. How do you take those distribution days into account? How do you use IBD’s big picture in conjunction with your indicators?
Thanks
He uses the IBD’s big picture very carefully!
While I may look at IBD’s big picture, I rely on the GMI for my assessment of the market trend.