On Friday there were 680 new 52 week highs in my universe of stocks, the most since December, 2010! If I had invested in the QQQ ETF since the GMI flashed a buy signal on July 30, 2012 my account would be up +8.3%, if in DIA +4.2%, SPY +6.2%, AAPL +16.2% and in QLD + 16.9%, . Investing in the leveraged QQQ 2X long ETF, QLD, again beats investing in these other things. How many times have I learned this lesson, to just invest in QLD when the GMI issues a buy signal (and QID when it issues a sell signal). It sure beats looking for the “needle in the haystack” that will outperform QLD. In fact, only 11 of the Nasdaq 100 stocks advanced more than QLD in this period. Furthermore, QLD during this period beat 89% of the Nasdaq 100 stocks and 86% of the S&P 500 stocks. And QLD is dependent on the Nasdaq100 stocks, not just one stock. Sometimes I think I should replace myself with a computer that will simply trade QLD or QID in accordance with the GMI signals. (I know the 3x technology bull ETF, TECL, did even better, + 25.9%.)
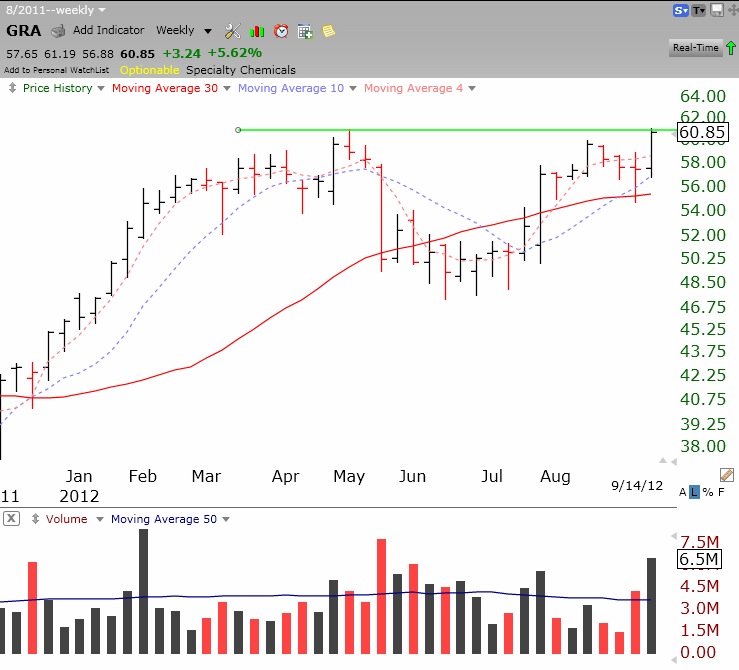
By the way, GRA had a cup and handle green line break-out last week. I had set a TC2000 alert weeks ago and when it triggered last week I bought some GRA. Check out this weekly chart and note the high trading volume last week. Click on chart to enlarge.