Last March I wrote that AAPL, at $461.91, was looking better because it had crossed back above its critical 10 week average. This GMMA chart shows that AAPL has now resumed an RWB rocket stock pattern. All of the shorter term averages (red) are now above the longer term averages (blue lines) with white space separating them.
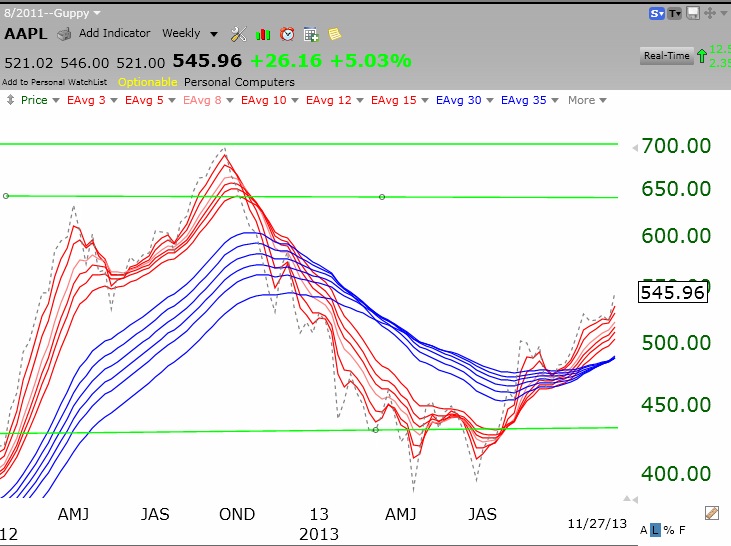
AAPL is also firmly in a Weinstein Stage 2 up-trend, back above its rising 30 week average (red line).
 I have made money consistently buying AAPL when it crossed above its 10 week average and selling when it crossed back below. I own AAPL again….
I keep reading articles about an imminent market top or bubble status. This may sell air-time or ads, but it is nonsense. No one can reliably predict the end of a market trend, except by luck. It is a great waste of time and emotional energy to pontificate about this. Bubbles and tops are only accurately portrayed AFTER they have occurred. Technical indicators have helped me in the past to get out of the market after the top but before most of the ensuing carnage. I am therefore concentrating on riding the current up-trend and keeping an eye on the GMI to alert me to potential trouble. When the GMI, posted to the right, reaches 0 or 1, I will look for the beginning of a real down-trend.
What are your thoughts re: the deterioration of T2108 while the market
has been heading higher?
T2108 only means something to me when it is at extremes, over 80% and less than 20%.