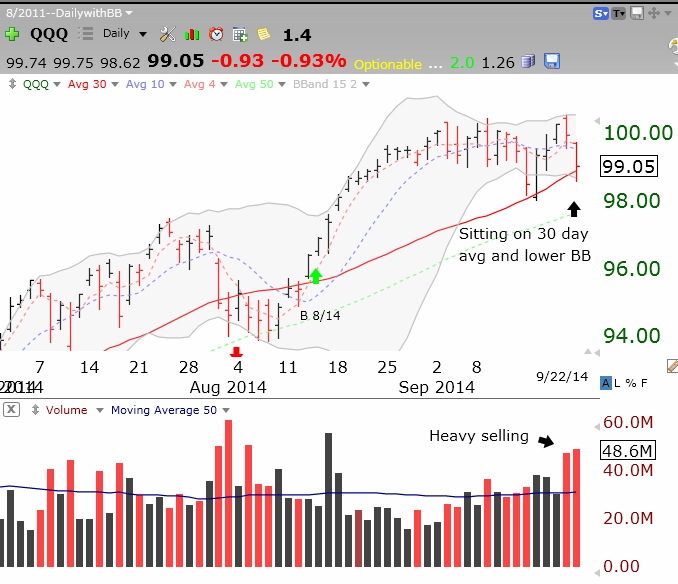
Tuesday will largely tell the story whether this 27 day long short term up-trend in the QQQ is likely to end. QQQ and SPY are sitting right on their 30 day averages and their lower Bollinger Bands. If they close below these key levels I suspect we are likely at the beginning of a significant decline. The T2108 indicator is now at 32%, lowest since it hit 28% on August 8, just before the latest up-trend began. And the GMI has fallen to 3. This daily chart of QQQ shows that the underlying Nasdaq 100 index is on critical support. Note also the heavy selling volume (red spikes) the past two days. (Click on chart to enlarge.)
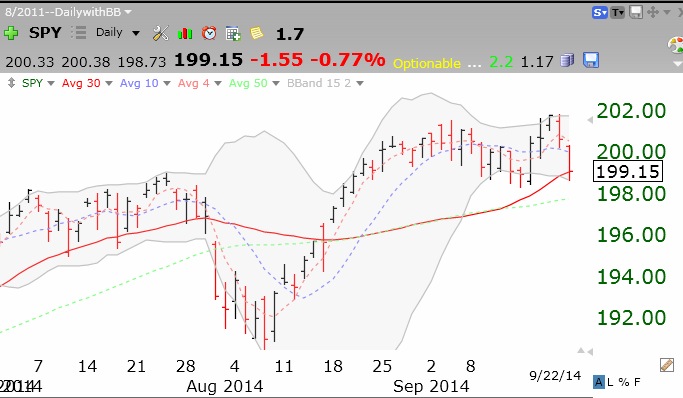
Note the similar pattern in the SPY:
Tuesday’s action will be very important to determining the near term trend of the market.