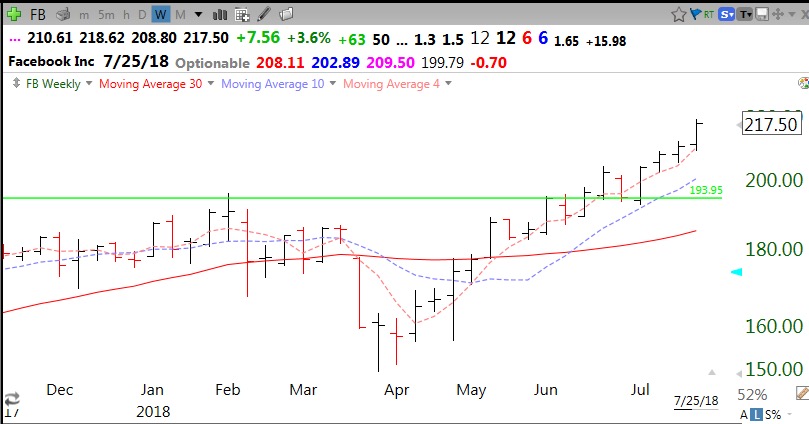
Nothing in my charts predicted the decline in FB. The only heads up was the date of earnings release, which was known to everyone months in advance. Below is the strong weekly chart of FB–before today. The little blue triangle shows where it is trading pre-market.