When I began trading in the 60s and knew nothing about technical analysis, I would make money when the market moved up and then lose the profits and more when the market receded. It wasn’t until I read Nicolas Darvas’ first book and later William O’Neil’s book (the books are listed below) and his newspaper, IBD, that I learned that to make money, one must trade consistent with the market’s trend. Both of these successful traders realized that most stocks follow the general trend of the market, as measured by the market indexes. Unlike the WSJ, IBD would actually advise readers to exit the market, and still does.
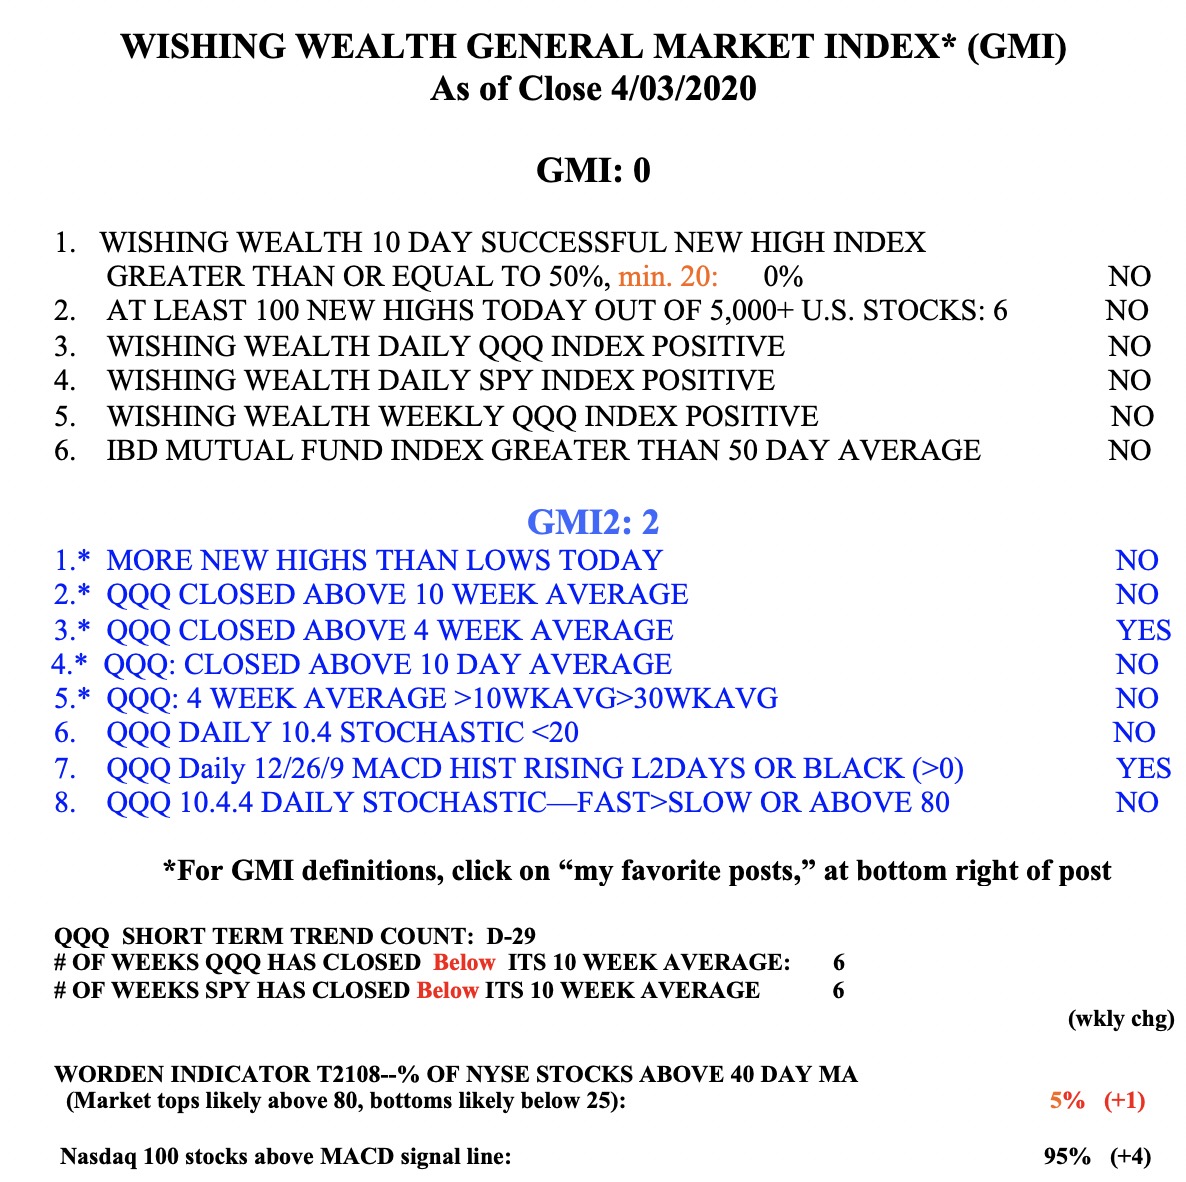
My General Market Index (GMI) has helped me to stay on the correct side of the market for years. It was so easy to make $$ until recently when the GMI was on a Green signal and consistently 5 or 6 (out of 6). When it is 0, like now, it means that my short and long term indicators are negative and I should go short or be in cash. This chart shows the QQQ when the GMI was Red or Green, from January 2017 through November 2019. Note that the GMI turned Red in October 2018 at the beginning of that decline. The GMI turned Red on February 26, 2020, not shown here, and currently registers 0 (see table below). The GMI got me out of the market once again. And no, it is not perfect and is late in detecting bottoms, but I interpret the GMI in the context of other indicators which I often write about.
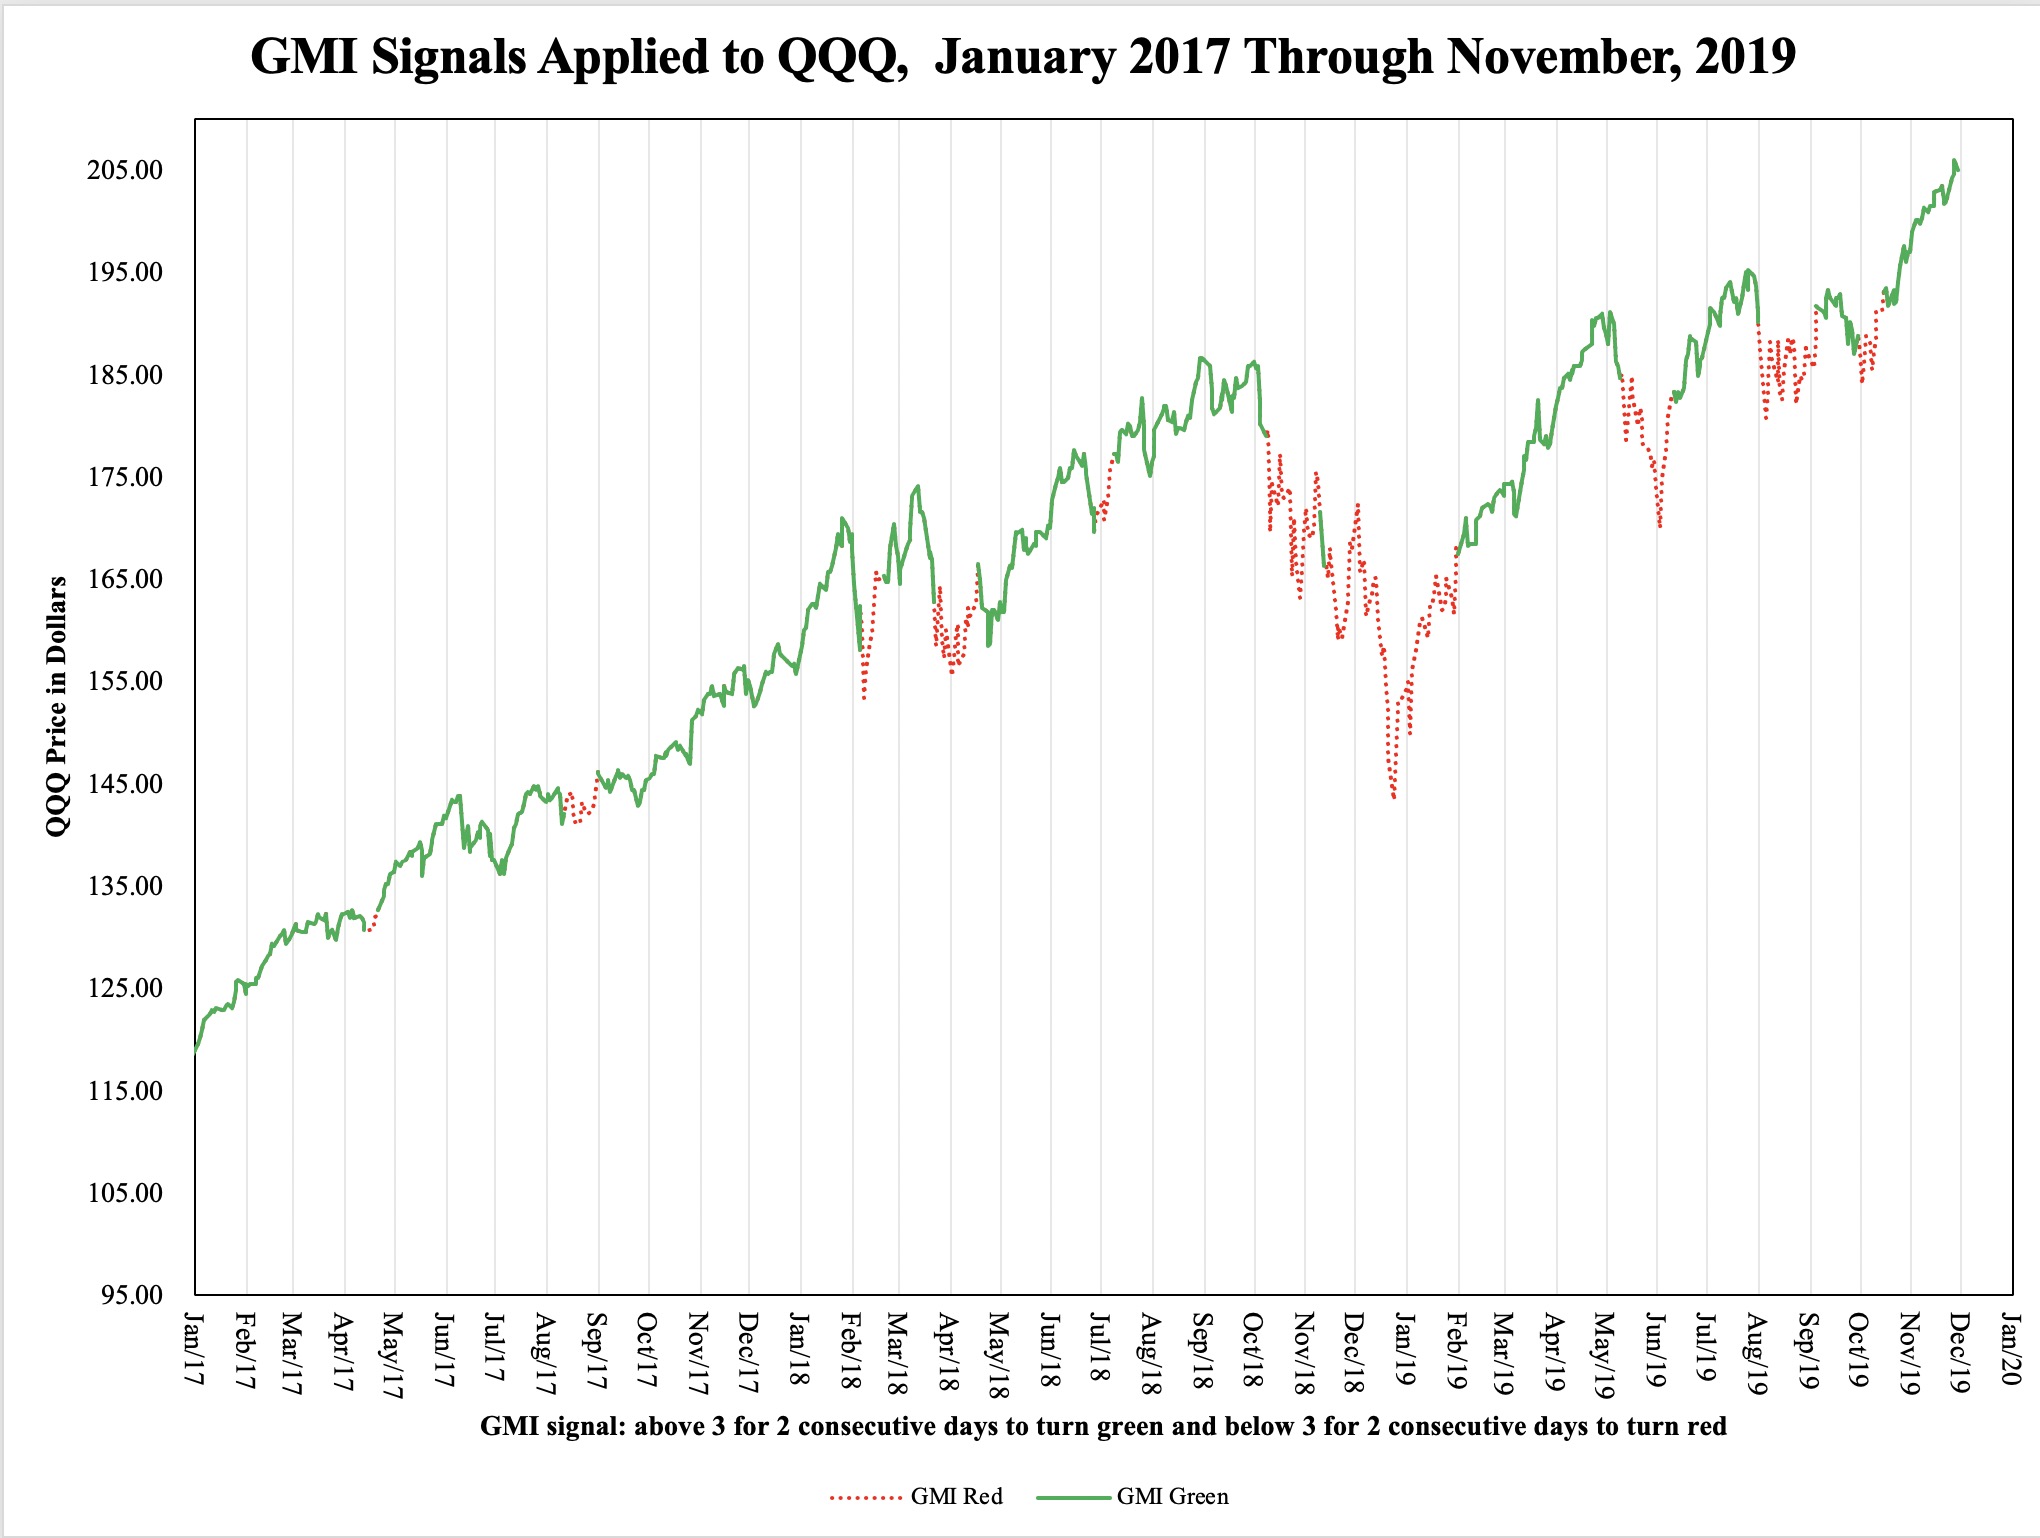
This is an excellent chart. Can you post the same chart with green/red indicators through today? …or thru March 2020? Thank you
DR. wish have you ran a backtest on the results over the years?