Most of the traders I admire (Darvas, Livermore, Ryan, O’Neil and Minervini) concentrate on buying promising growth stocks that have advanced in price, built a base, and then emerge to an ATH (all-time-high) with a burst of trading volume. I find such stocks using my GLB (green line break-out) technique. I draw a green line on a monthly chart at the peak price after the peak has not been surpassed for at least 3 bars (months). I then often put an alert in TC2000 that emails or texts me immediately when the break-out occurs. I then can look at the chart and the volume buzz on TC2000 to tell me whether the GLB is occurring with above average trading volume. However, most of us who earn a living working and are not professional traders need a less eyes on the market and part-time approach to trading/investing.
Enter weekly charts. The great William O’Neil relied on weekly charts because they reduced the noise (volatility) that is found in daily charts. He could discern the trend better. Many times I look back at a strong stock that I was shaken out of because of its daily volatility only to find that its weekly chart could have kept me from selling. I have created a note on my monitor that says I must look at the weekly chart before I sell. It turns out that one can use weekly charts to see the true market winners as they emerge from a GLB and the required above average volume. To find these I created a late Friday or week end column scan in TC2000 with the following conditions, all done on the weekly time frame.
Syntax is: High this week was the highest in 50 weeks: H=maxH50; High this week was at least 200% the high 50 weeks ago or greater than 150% of the lowest low the past year: H>2H50 or H>1.5MinL50; Volume this week is greater than 130% of average volume the past 50 weeks: V>1.3*AvgV50; Closed this week greater than $20: C>20
The great Nicolas Darvas looked for stocks that had at least doubled over the past year. Past behavior predicts future behavior. Want to find a stock that will double in a year? Find one that has already done so. Taser went up 7x, consolidated, and then went up 7x again. I also accept if the stock has doubled from its lowest point in the past year. I don’t buy cheap stocks. Hence my minimum price of $20.
After I run this column scan I then look at each monthly chart for stocks that have passed it and draw in the appropriate green line. If it had a GLB recently I may become more interested in pursuing the stock. This weekend this scan came up with 74 out of 5,096 US stocks and 25 out of 948 stocks in my IBD/MarketSmith stocks watchlist. Among these 25 that had had a recent GLB are: APPS, TRUP, DKNG, FVRR, NVCR, GRVY, NVTA, PENN, SWAV, WKHS. (DKNG had a rare flag pattern but not a GLB.) Stocks that have doubled already and can come through a declining market to all-time-highs on above average trading volume may prove to be true market leaders. Here are a few of their weekly charts:
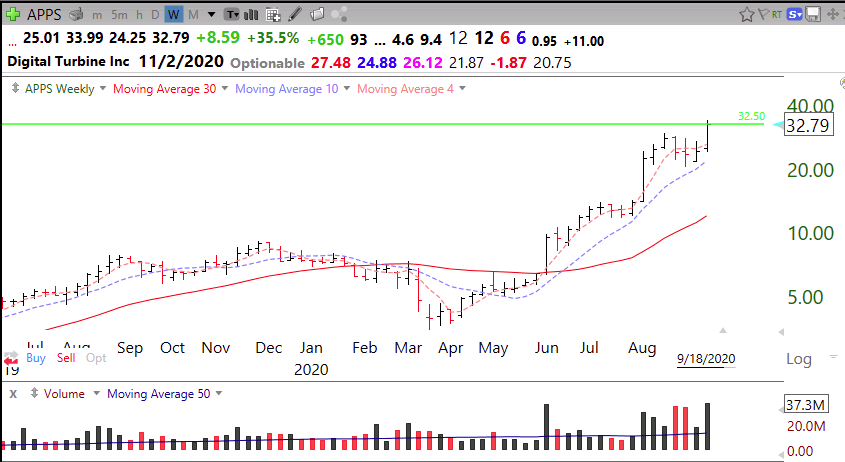
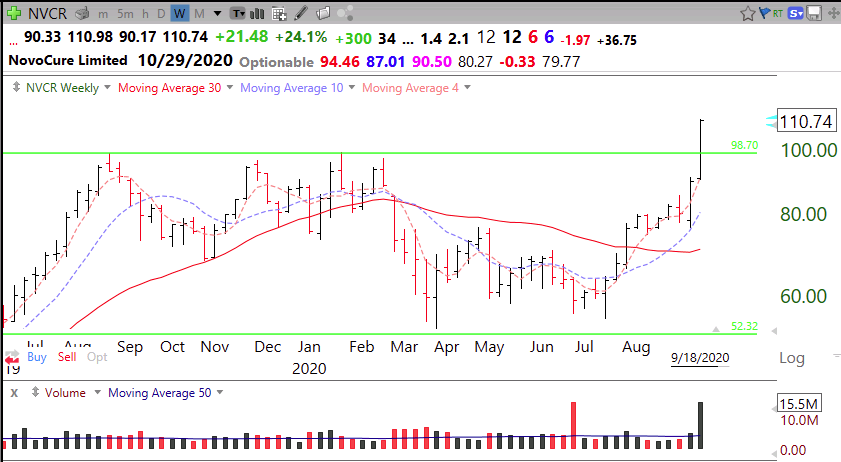
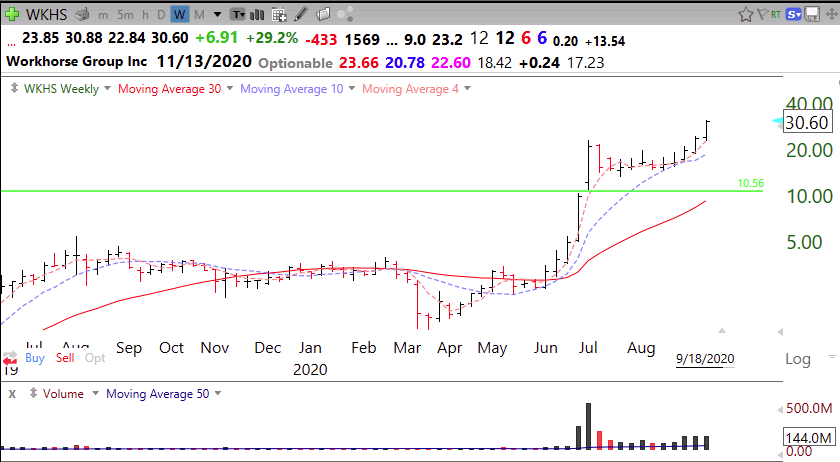
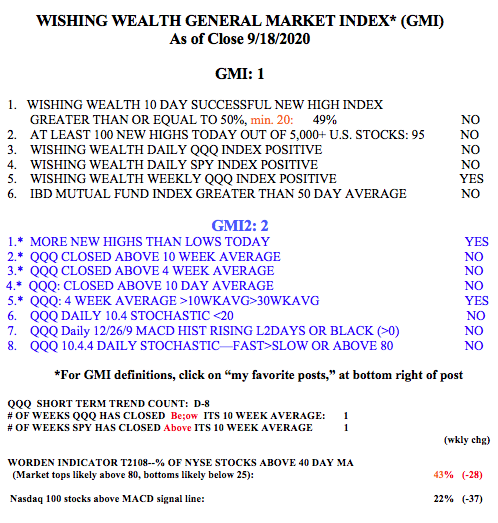
These stocks are acting strong in a weak market. However, the GMI= 1 (out of 6) and remains on a Red signal. This type of market requires me to hold small positions with close stops and maybe an inverse index ETF…
Thank you for the time you put it in service to your readers
I agree with Mr. Klopp. Thank you Professor!