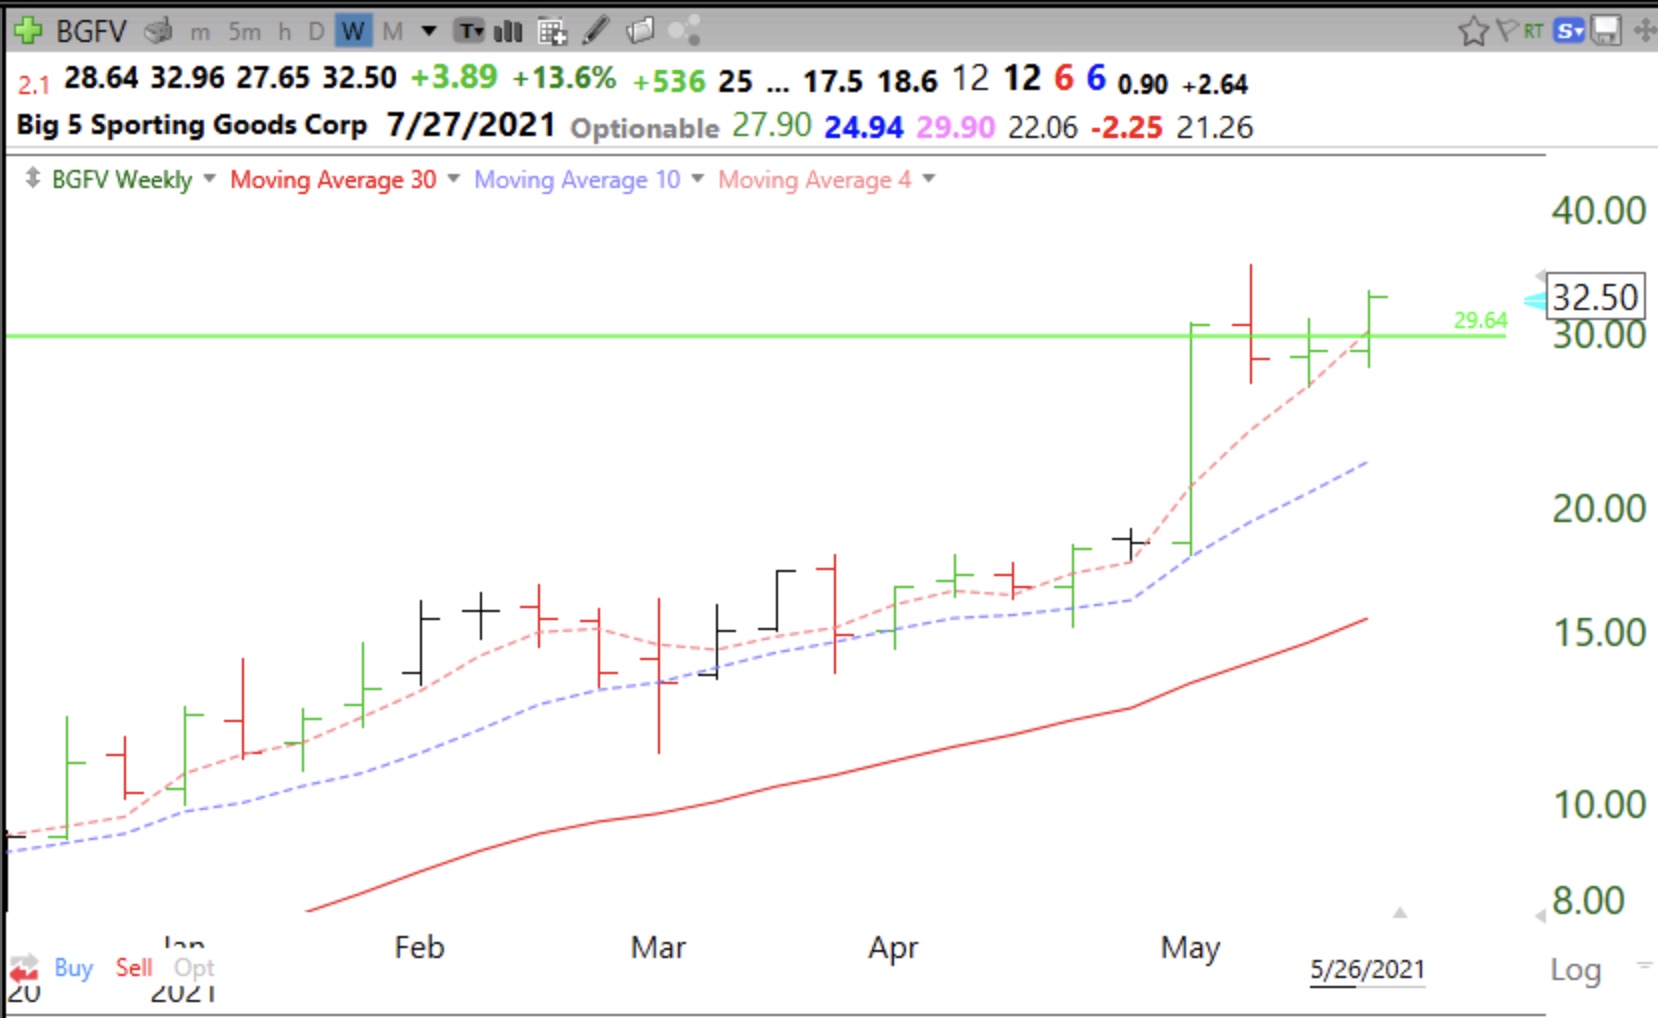
Weekly chart shows WGB (weekly green bar) signal that occurs when stock has 4wk>10wk>30wk averages and it retakes 4wk avg (pink dotted line) and closes up from prior week’s close.
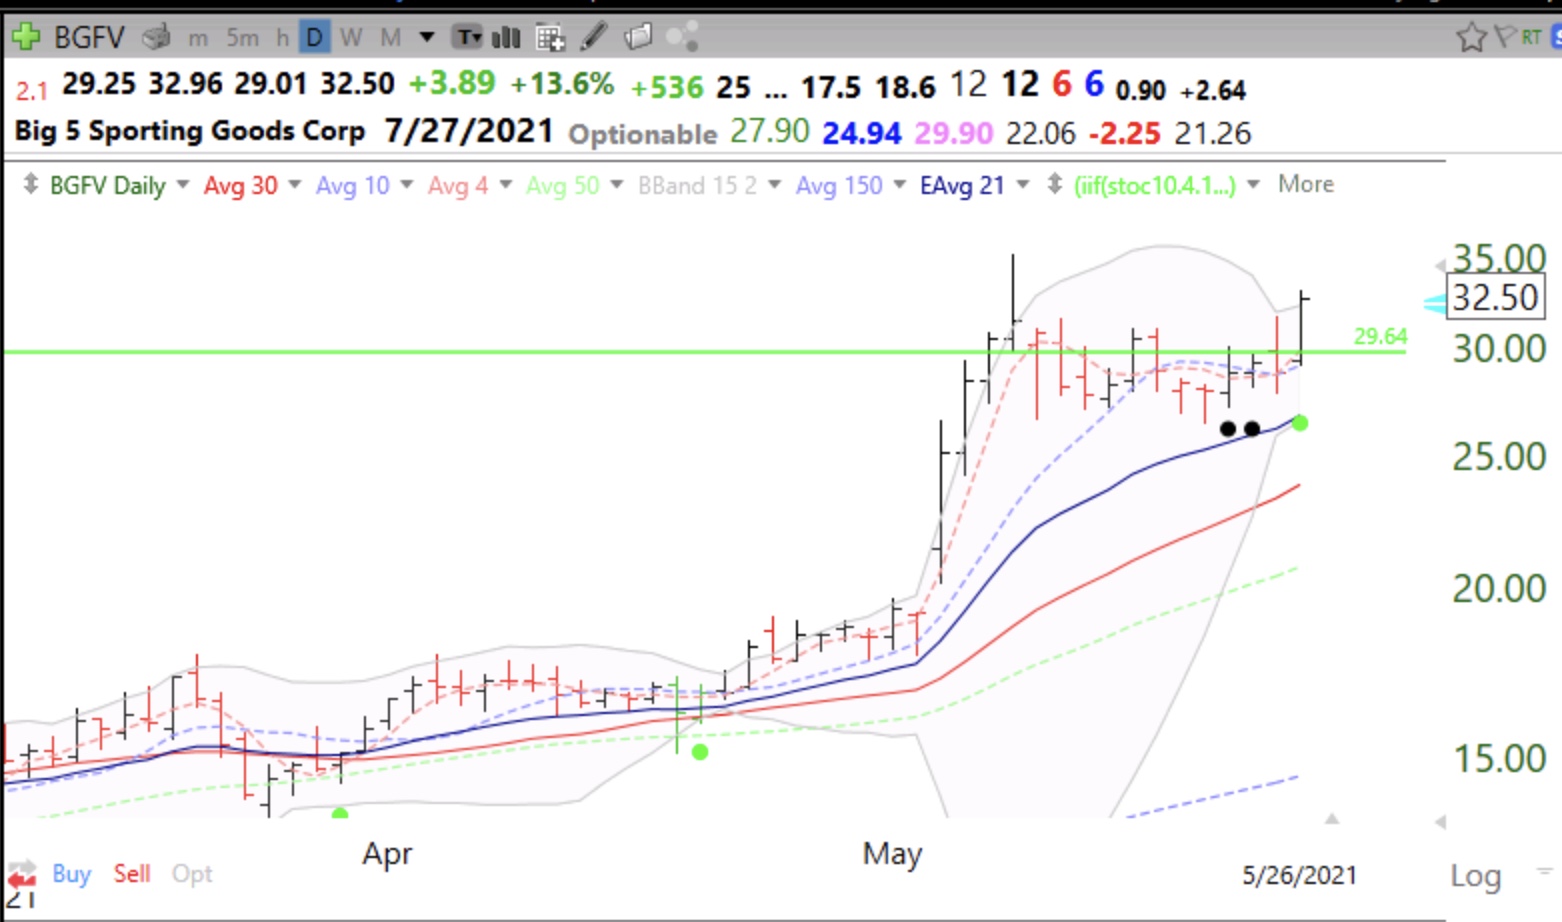
Note recent black dots (oversold bounces) and green dot indicating daily 10.4 stochastic crosses above daily 10.4.4 stochastic.