The charts tell a dire story. All major indexes ($IWM, $DIA, $SPY, $QQQ) are below their critical 30 week moving averages, which are beginning to curve down. A moving average turns down when the current period’s value being added to the total is below the value of the furthest period being dropped. The fact that the 30 week average is declining means the current week’s price is lower than the price 31 weeks earlier. How much more evidence do we need to show that the averages are weak. The put/call ratio (.88) and T2108 (22%) are still not at the extreme levels typical of a bottom. And if many are looking for a bottom to hop back in, it is probably too early. When the media give up and expect a long bear market we will be near the bottom. I will never forget that the WSJ Heard on the Street column wrote, “if anything we are sure of, the market has further to fall” exactly on the day the bear market bottomed about 50 years ago.
The job of the trend follower is to get out of the way of a declining market and wait until there are signs of a bottom. So I am in cash in my trading account and in most of my university pension accounts. I don’t make recommendations. My policy is to share what I am doing and to let everyone make their own decisions based on their knowledge and risk tolerance level. I don’t worry about getting back in at the bottom. Just remember, if one sells out at $100 and the equity falls, I only have to get back in by $100 to not miss anything but the heartache of a substantial decline in price and panic selling. Be careful. If this turns out to be a multi-month bear market, there will be many short snap back rallies which will suck you in and then clobber you. I will demonstrate this in my webinar for the AAII Eastern Michigan Chapter Tuesday evening. You may register for this free webinar here.
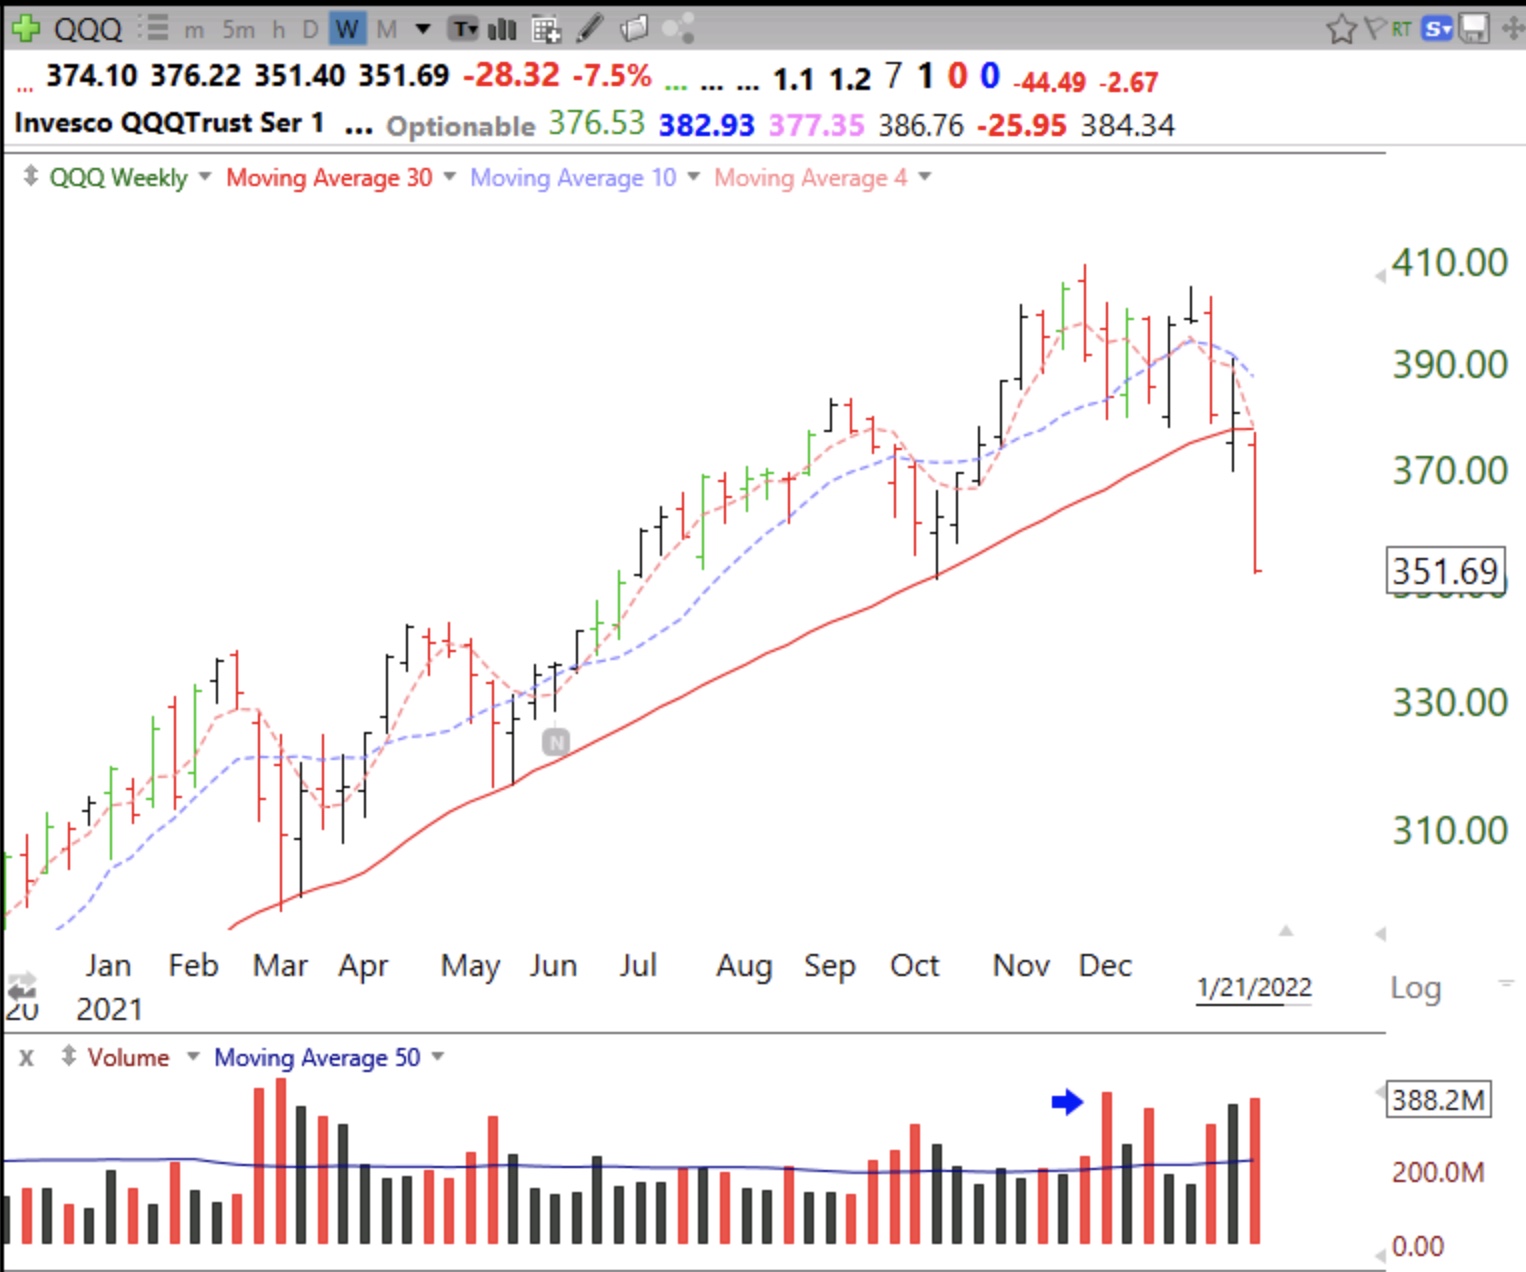
Below is the weekly chart of $QQQ. Note the recent weeks of above average volume selling.
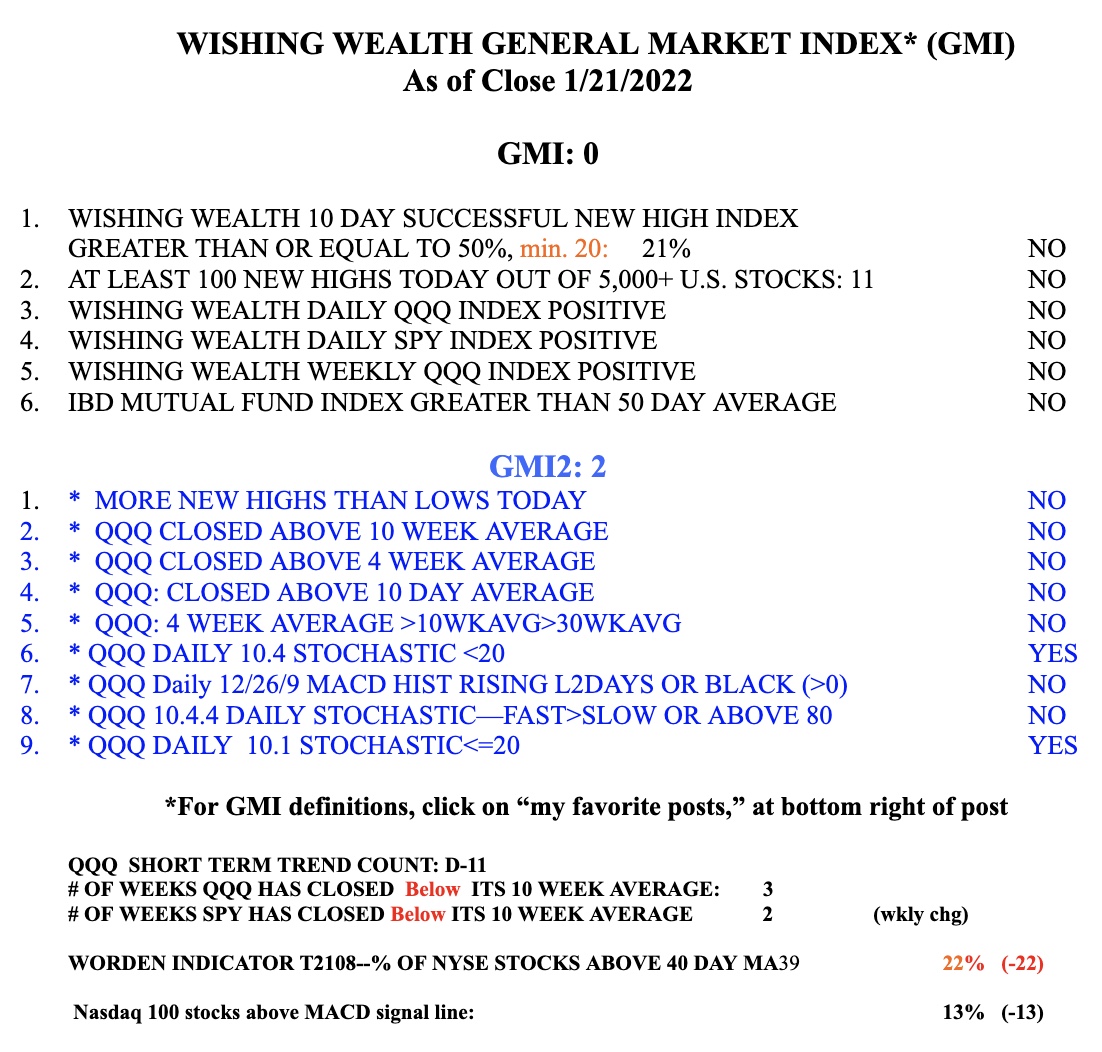
The GMI=0 (of 6) and on a Red signal. It is so much more profitable to buy stocks when the GMI is Green.
I had registered for the Michigan AII Webinar, but was not able to attend. How can I get the recording?
Thanks
Dr.Wish, Same here. How can we access your webinar?Thank you
Dr. Wish, How can we access your webinar? Would love to see it! Thank you!
Google TraderLion Conference Dr. Wish