Last week I tweeted, @WishingWealth, how my Weekly 10:30 charts helped me to stay on the right side of the market. As long as the 10 week average is above a rising 30 week average the market is in an up-trend. When the reverse is true it is time for me to be short or in cash. The Weekly 10:30 chart helps me to know the trend but I use finer criteria to time the exact entry or exit.
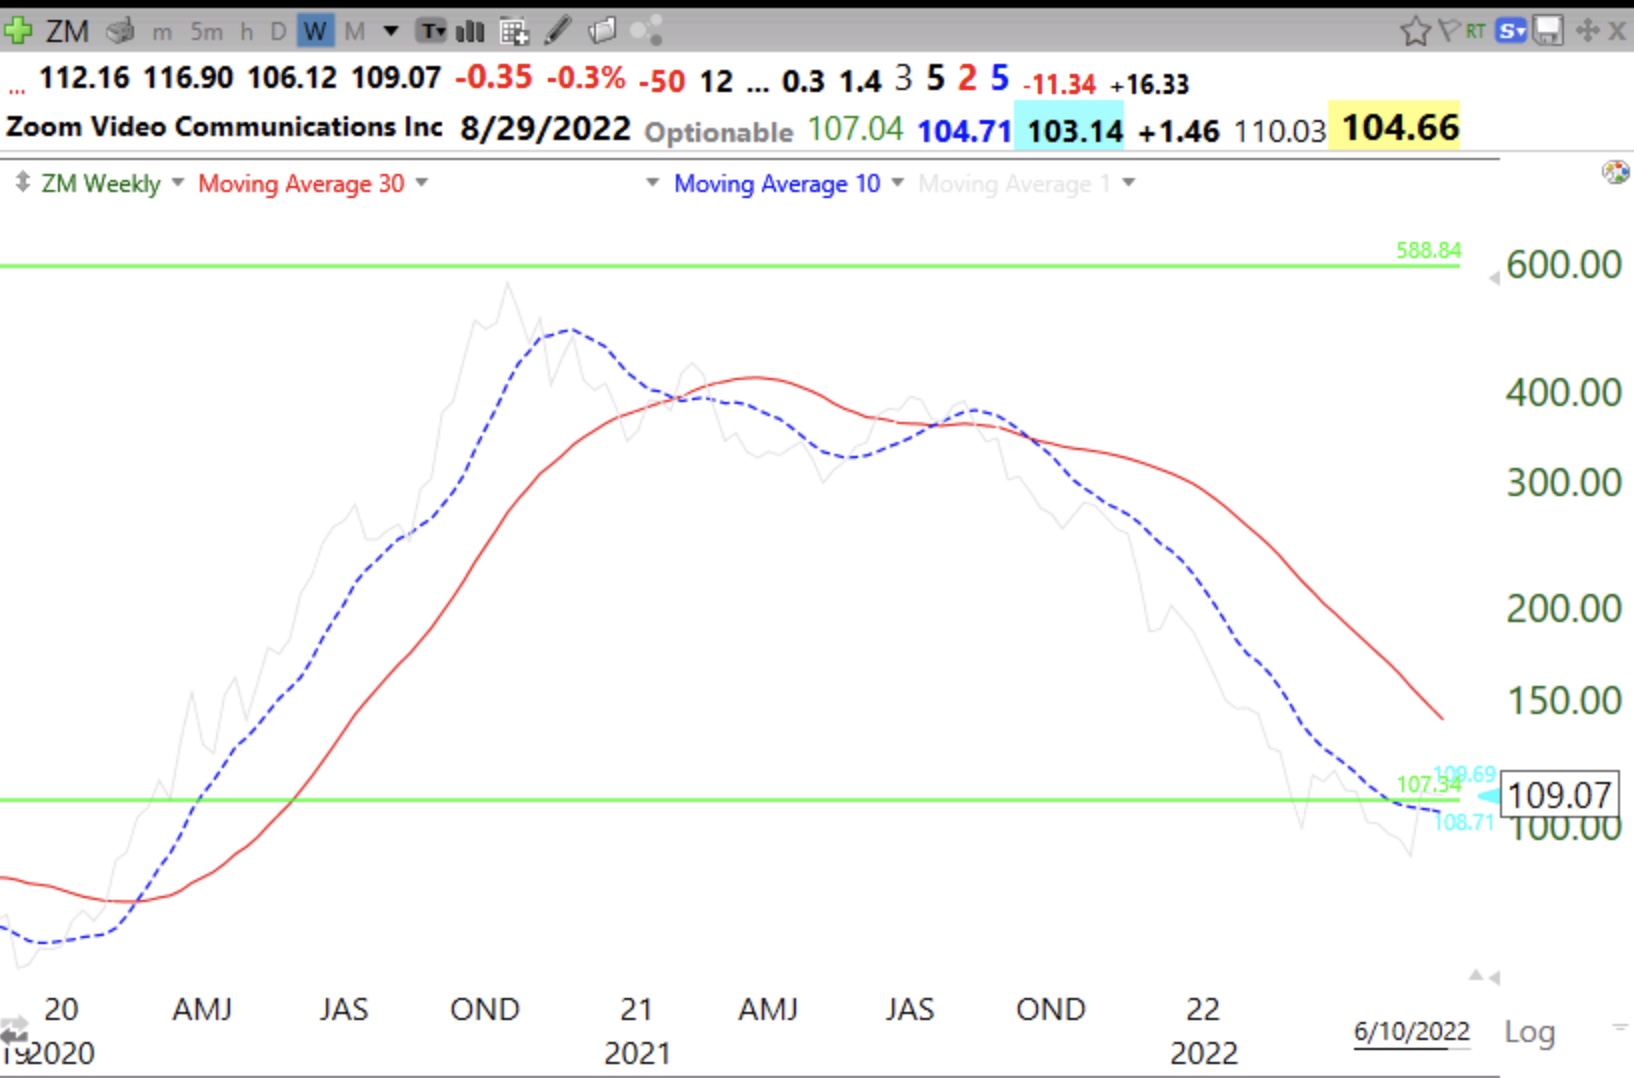
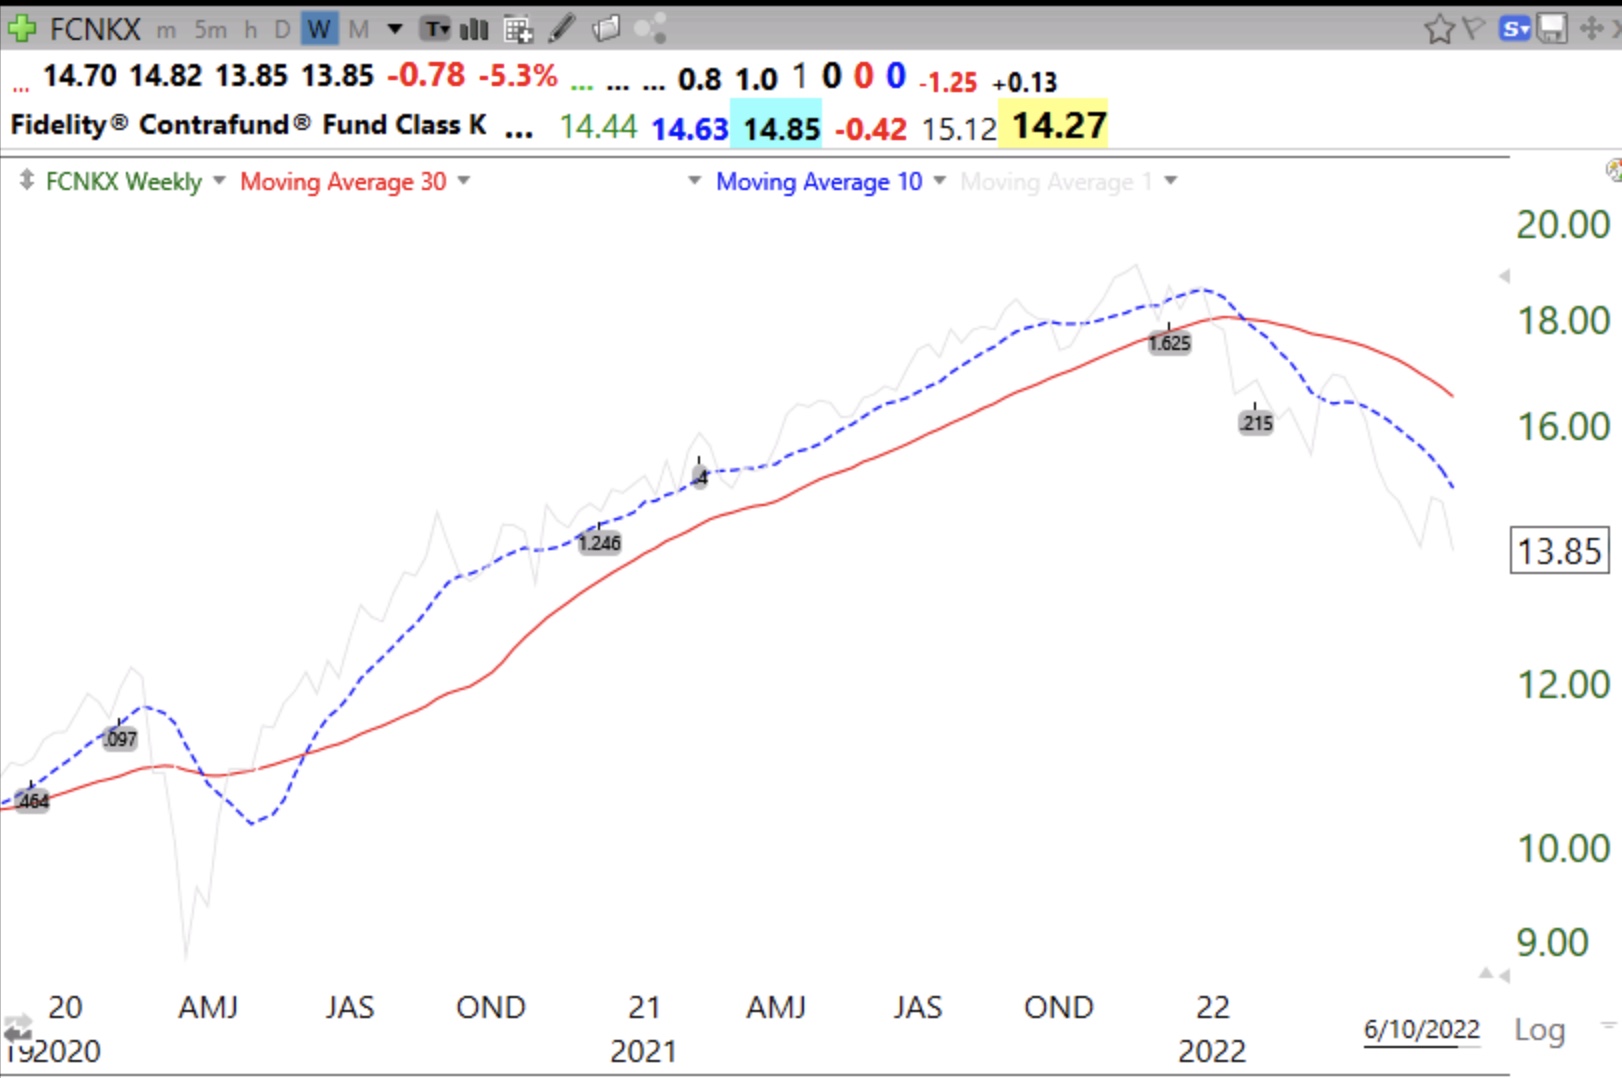
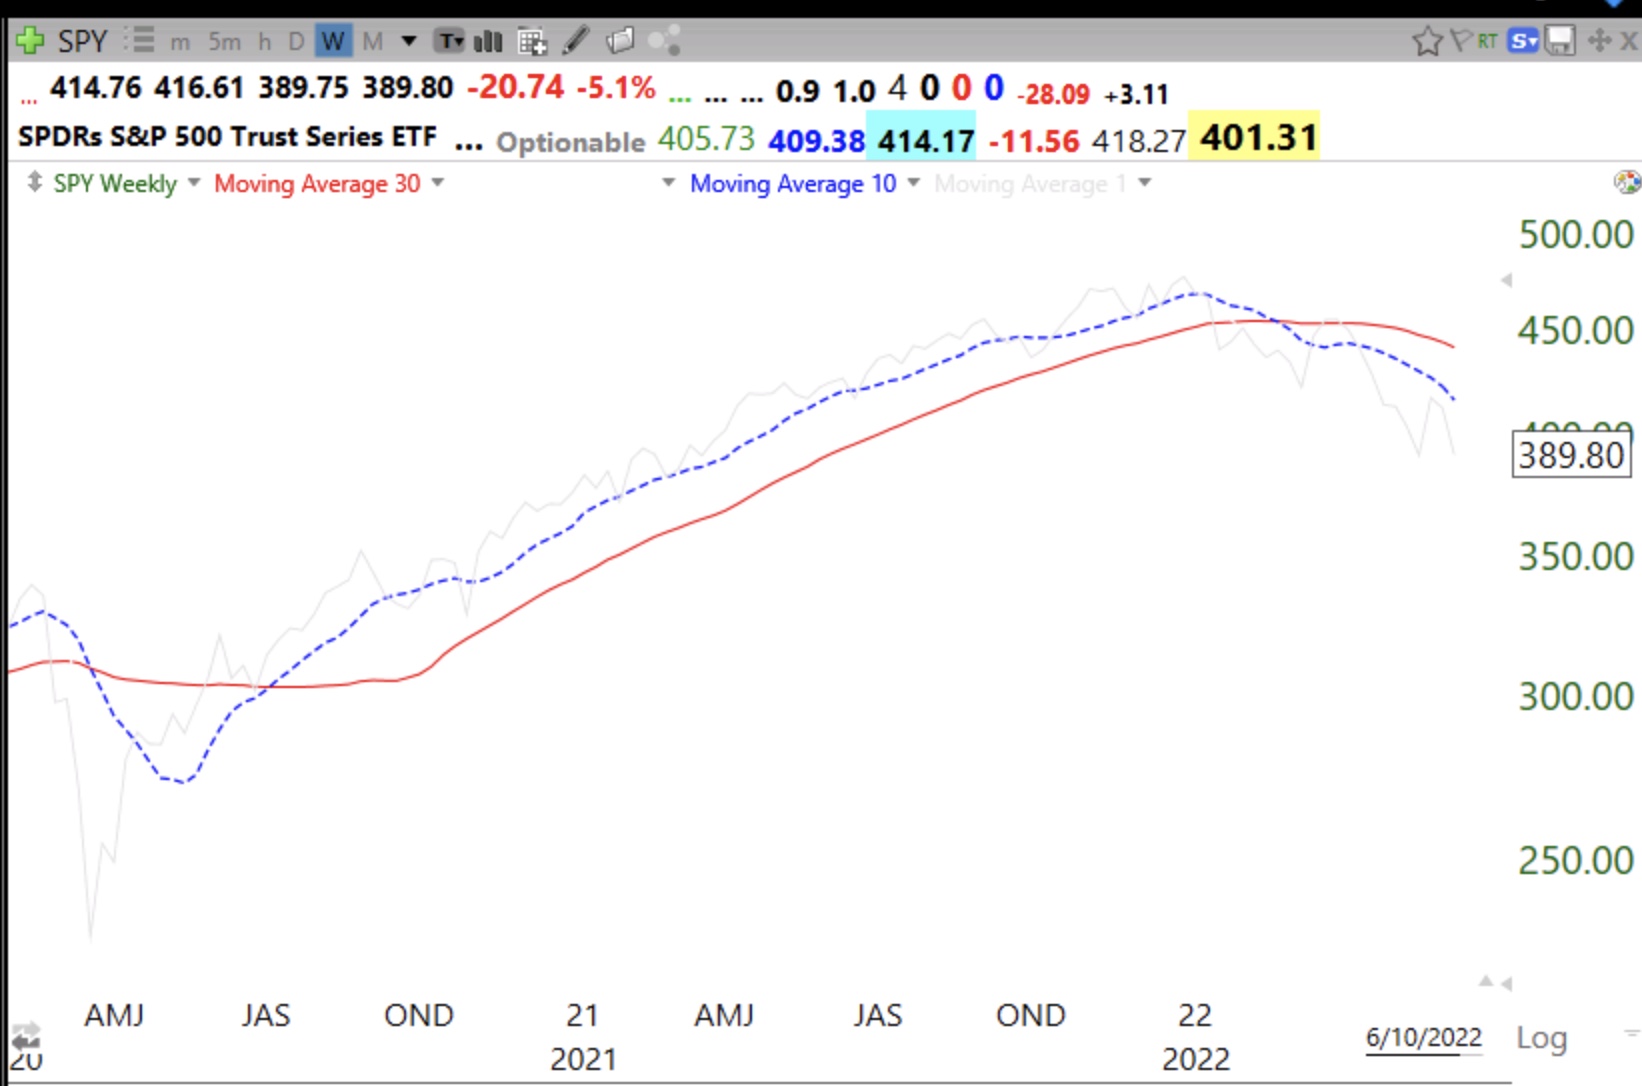
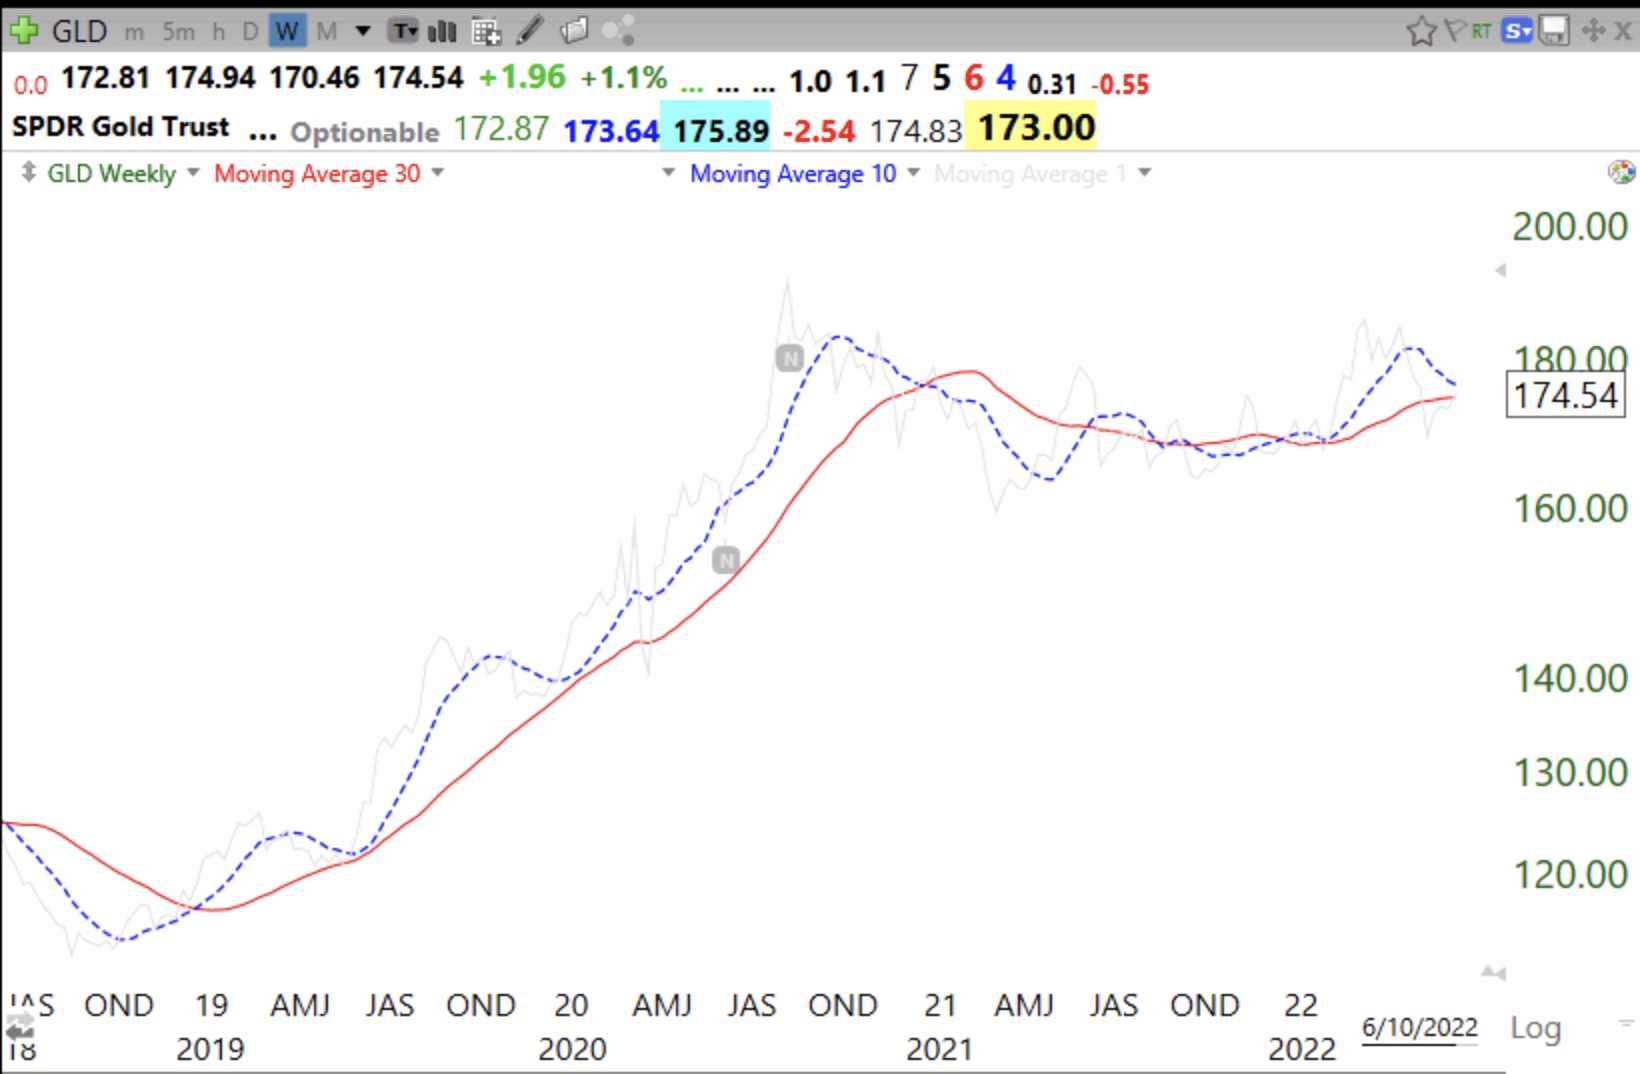
In addition, I do not want to hold or purchase any security unless it has the 10 week above the rising 30 week. See how these weekly charts show the trend of both a stock and a mutual fund. The 10 week average is the dotted line. The gray line in the background shows the weekly closing price. When the weekly close is below the 30 week average I become defensive and look for a possible exit.
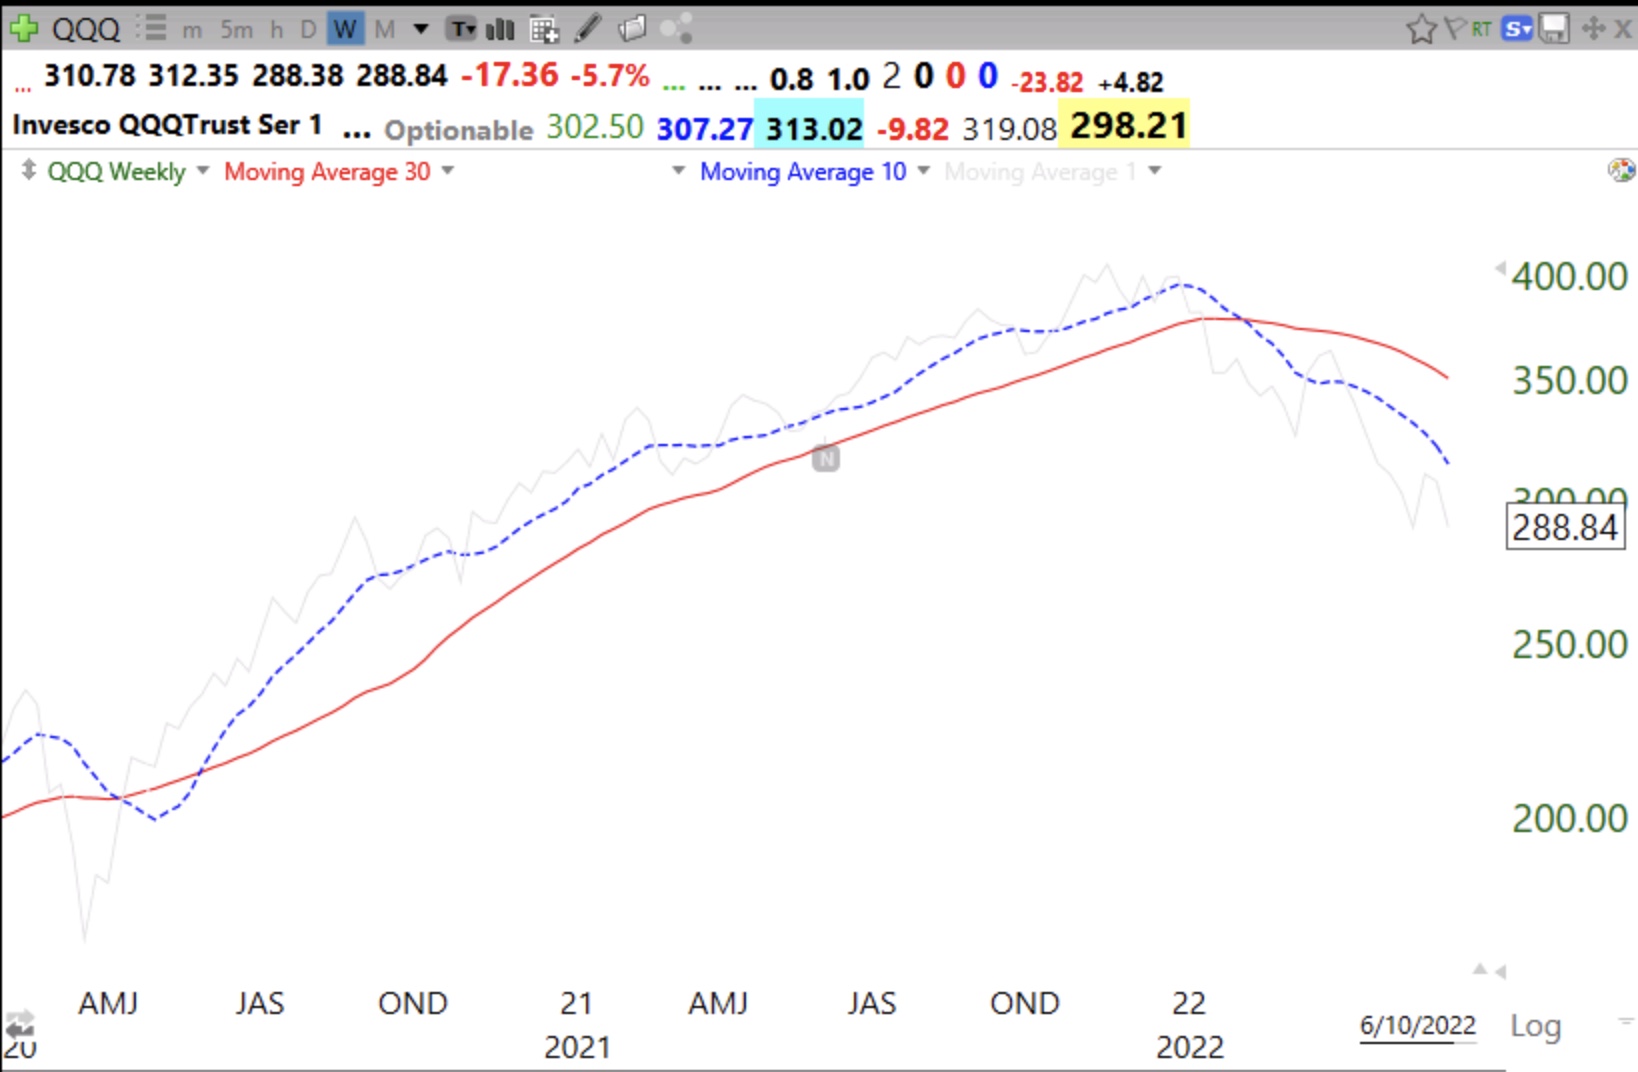
QQQ is in a down-trend.
As is SPY.
And GLD closed back above its 30 week average and may be turning up.
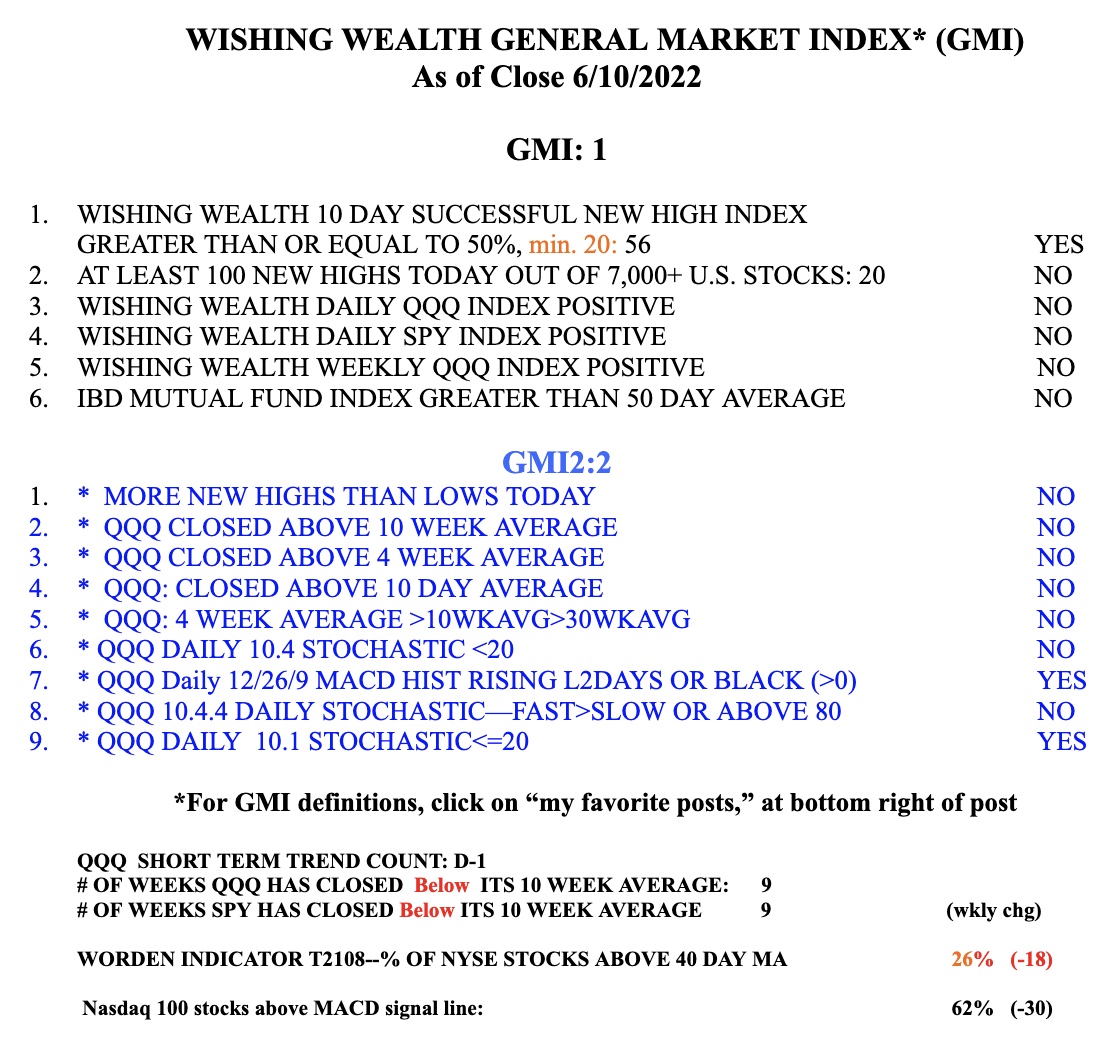
And the GMI is 1 (of 6) and back to Red.