On May 12, we had 1,625 US stocks at new lows. So today’s number of 1,115 is not as extreme. The GMI is now =0. It is so much easier to make money buying stocks when the GMI is Green and =6. The last time the GMI= 6 was November 18, near the market top! It had registered 6 for 24 straight days.
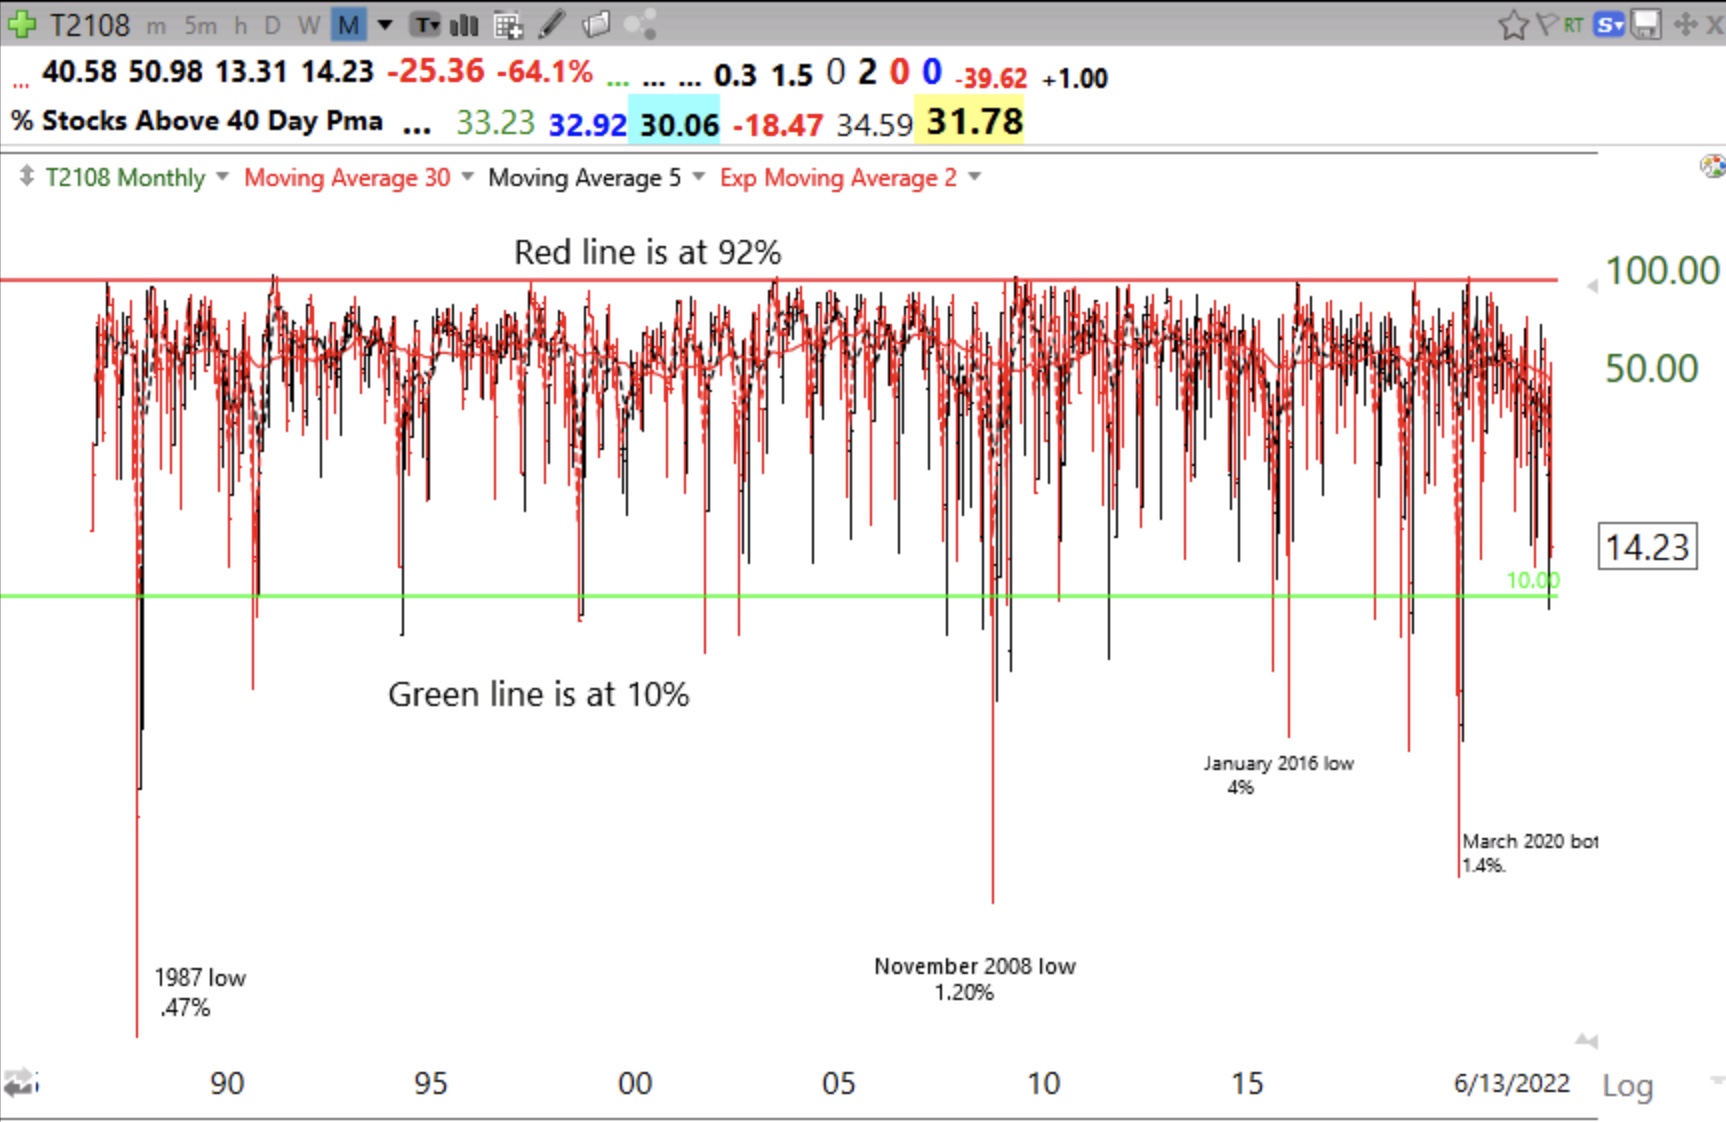
However, the indicator I find most useful in discerning a bottom is the Worden T2108 indicator. It can be found daily on TC2000 or created manually on other charting programs. I post T2108 every day on this blog. T2108 measures the percentage of NYSE stocks that are above their simple 40 day moving average. This monthly chart shows that T2108 is extremely low when it reaches single digits, below the green line. It closed today at 14% and dipped intraday to 9.2% at the bounce on May 12.
Every year I tell my class that one should back up the truck and buy some SPY, not an individual stock, the next time T2108 is below 10%. I tell these aspiring undergraduates to use a very small percentage of their account and then to accumulate more only as SPY moves up and the bottom is in. However, each time T2108 gets that low I am usually too scared to buy SPY. That is because in order for stocks to become so oversold, the news is usually very scary. Since I went to cash in November, I promise that this time I will buy SPY, I hope…..
On your final comment …… I hear you!
Yep, just close your eyes and buy when T2108 goes below 10. I personally like buying when it’s below 15.5