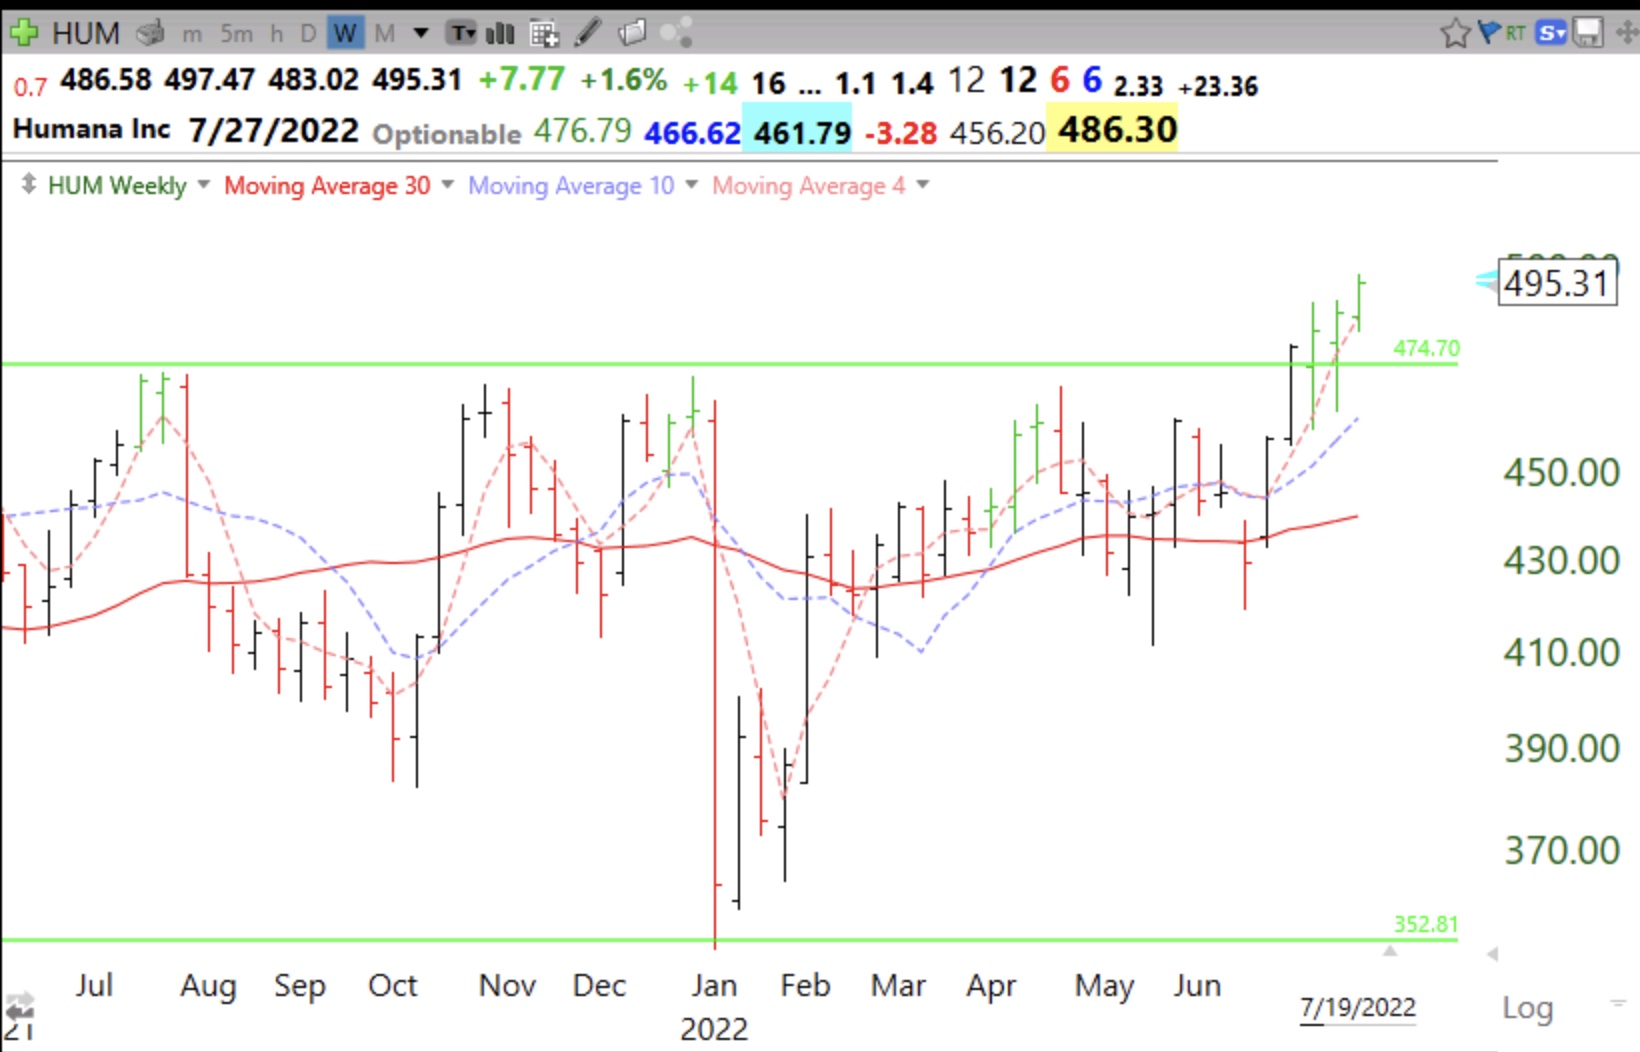
Here is the weekly chart of HUM. Note the three green bars in a row, indicating bounces up off of the rising 4 week average. A weekly close below the 4 week average (red dotted line) would be a sign of weakness.
Stock Market Technical Indicators & Analysis
Here is the weekly chart of HUM. Note the three green bars in a row, indicating bounces up off of the rising 4 week average. A weekly close below the 4 week average (red dotted line) would be a sign of weakness.