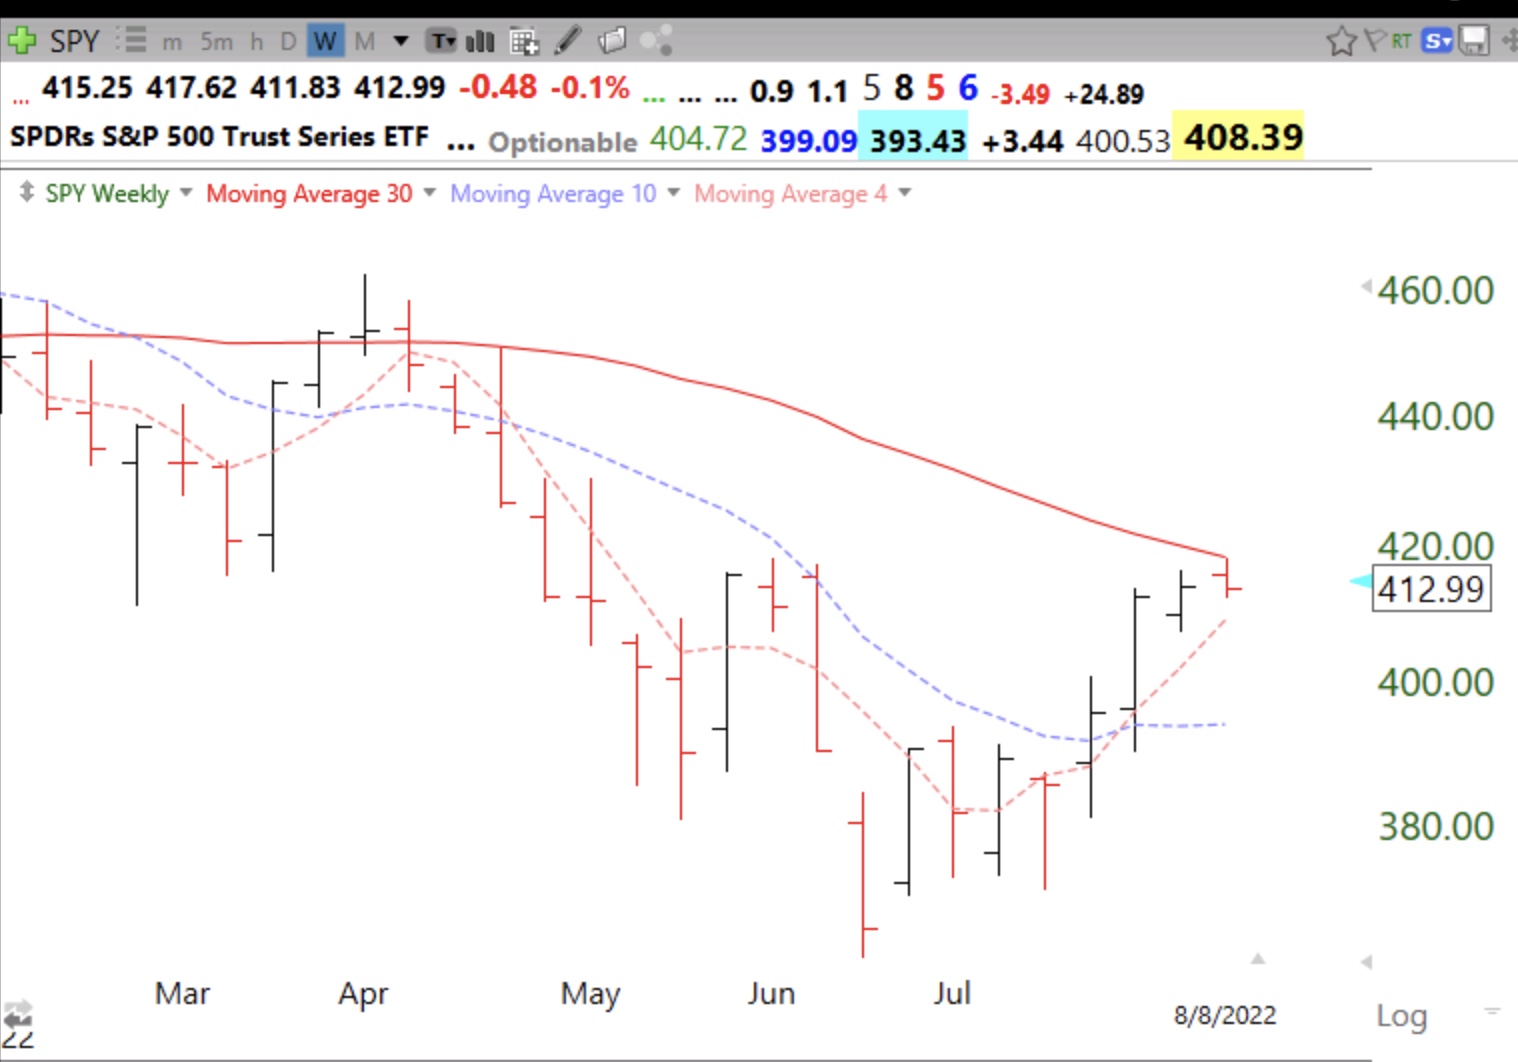
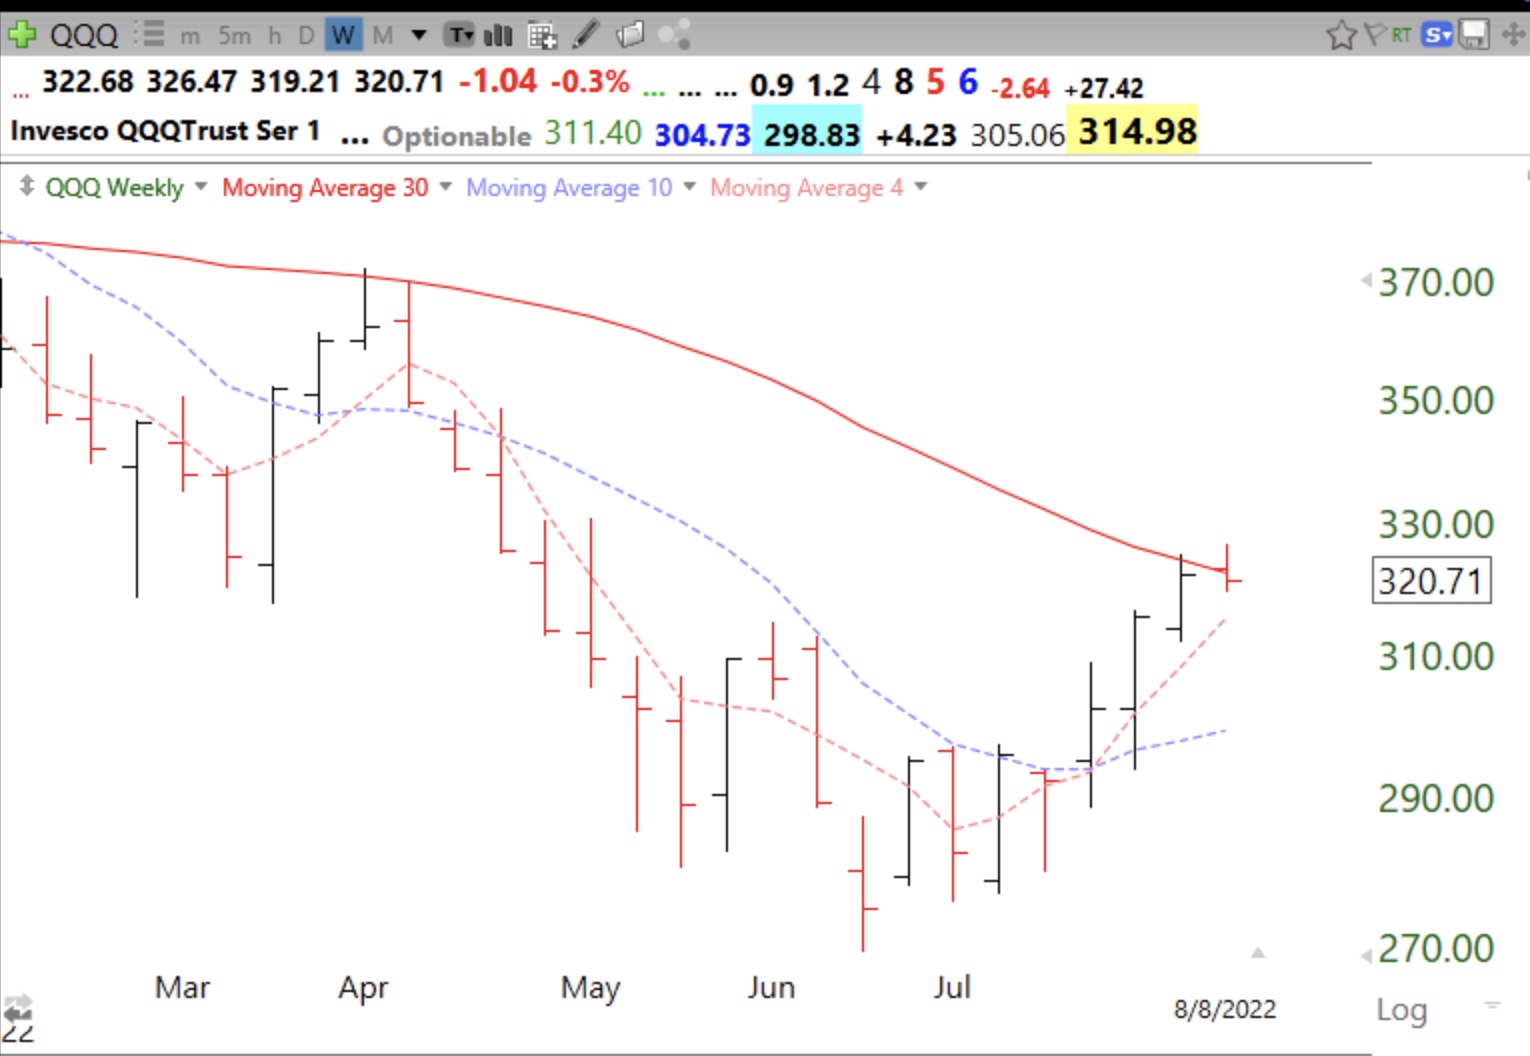
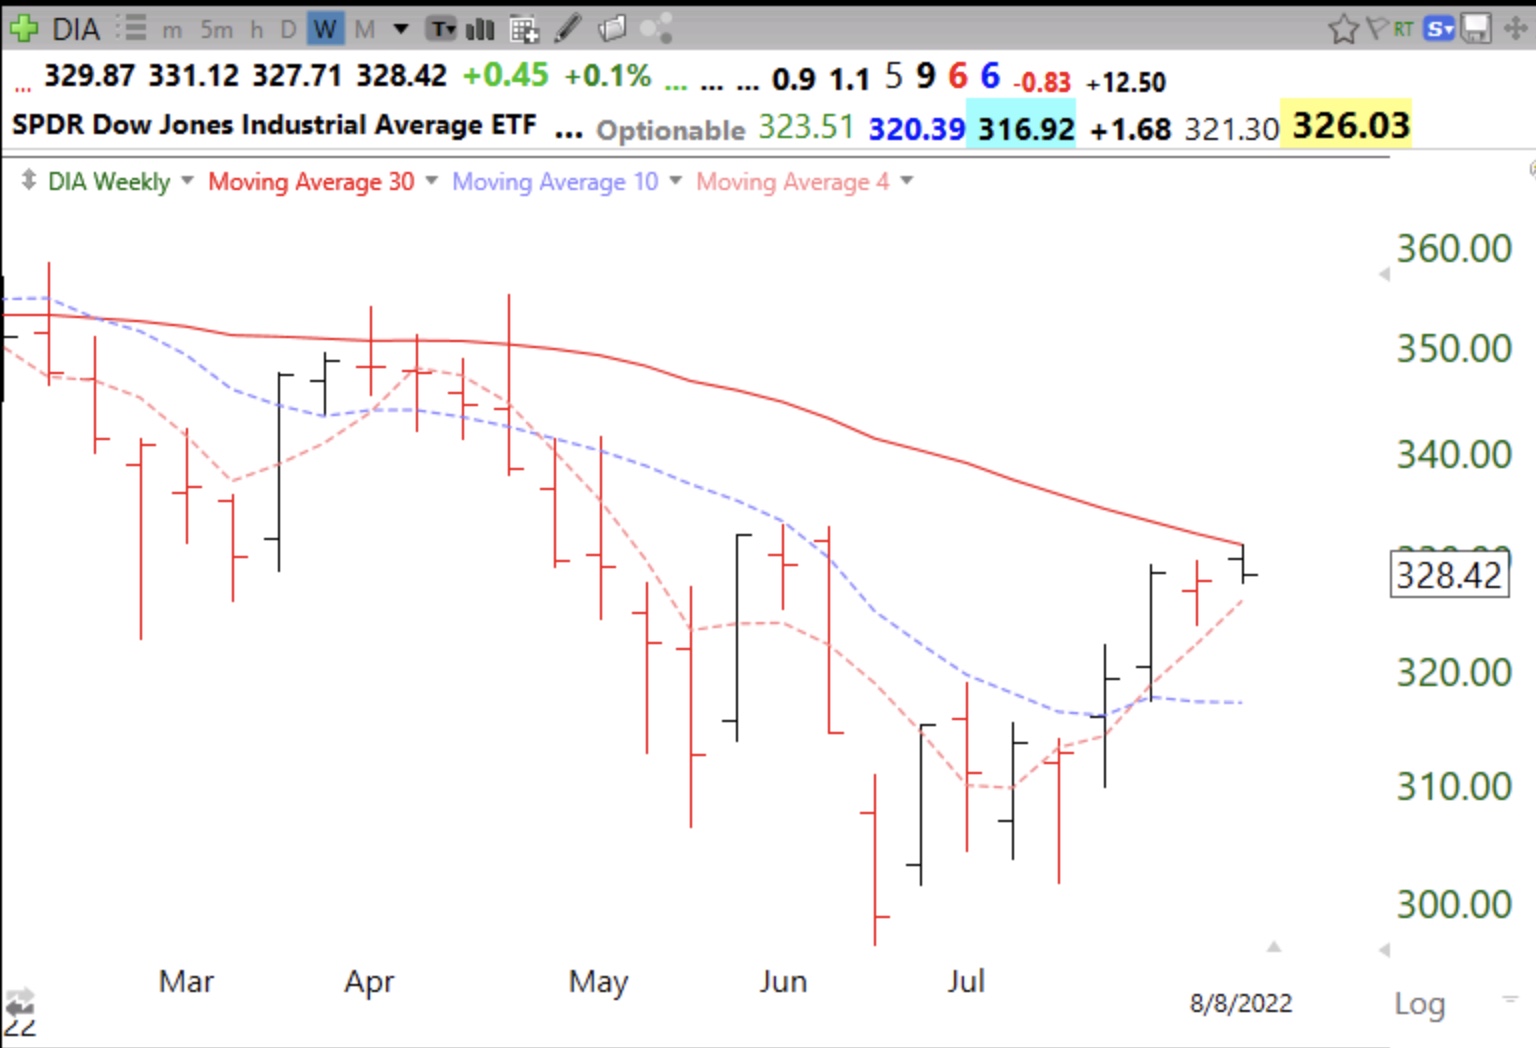
QQQ and DIA look like SPY. Failure to climb above declining 30 week average this week could signal more weakness. This is a weekly chart. Look what happened last April.
Stock Market Technical Indicators & Analysis
QQQ and DIA look like SPY. Failure to climb above declining 30 week average this week could signal more weakness. This is a weekly chart. Look what happened last April.