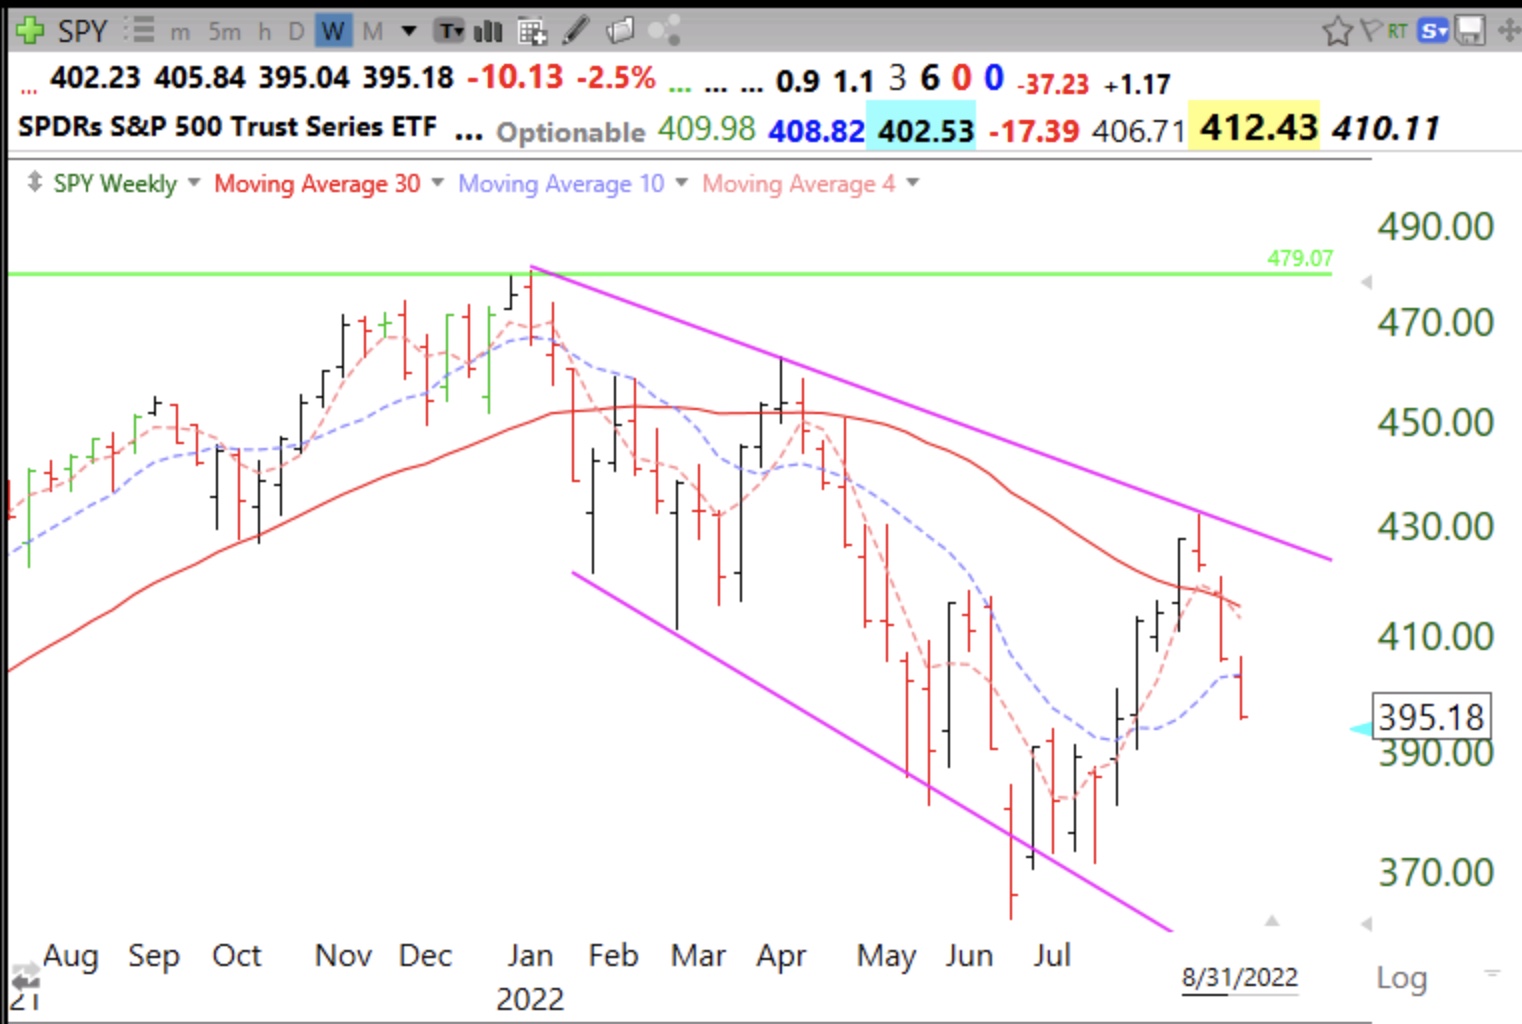
Decline is reminiscent of what happened last April when SPY failed to hold above 30 week average (solid red line). Will this decline take out June’s lows? No one knows but it is better to stand aside. After a new up-trend begins it is much easier to make money going long.