2 thoughts on “Blog Post: 13 US new highs and 888 new lows; 1 ATH; p/c ratio=1.14; more bears than bulls again; they finally shot the general–$AAPL, see charts”
Do you draw those green lines, or is there a formula in TC200 that you use, Dr Wish? I am new to your blog having watched your TraderLion session recently. C
Loading...
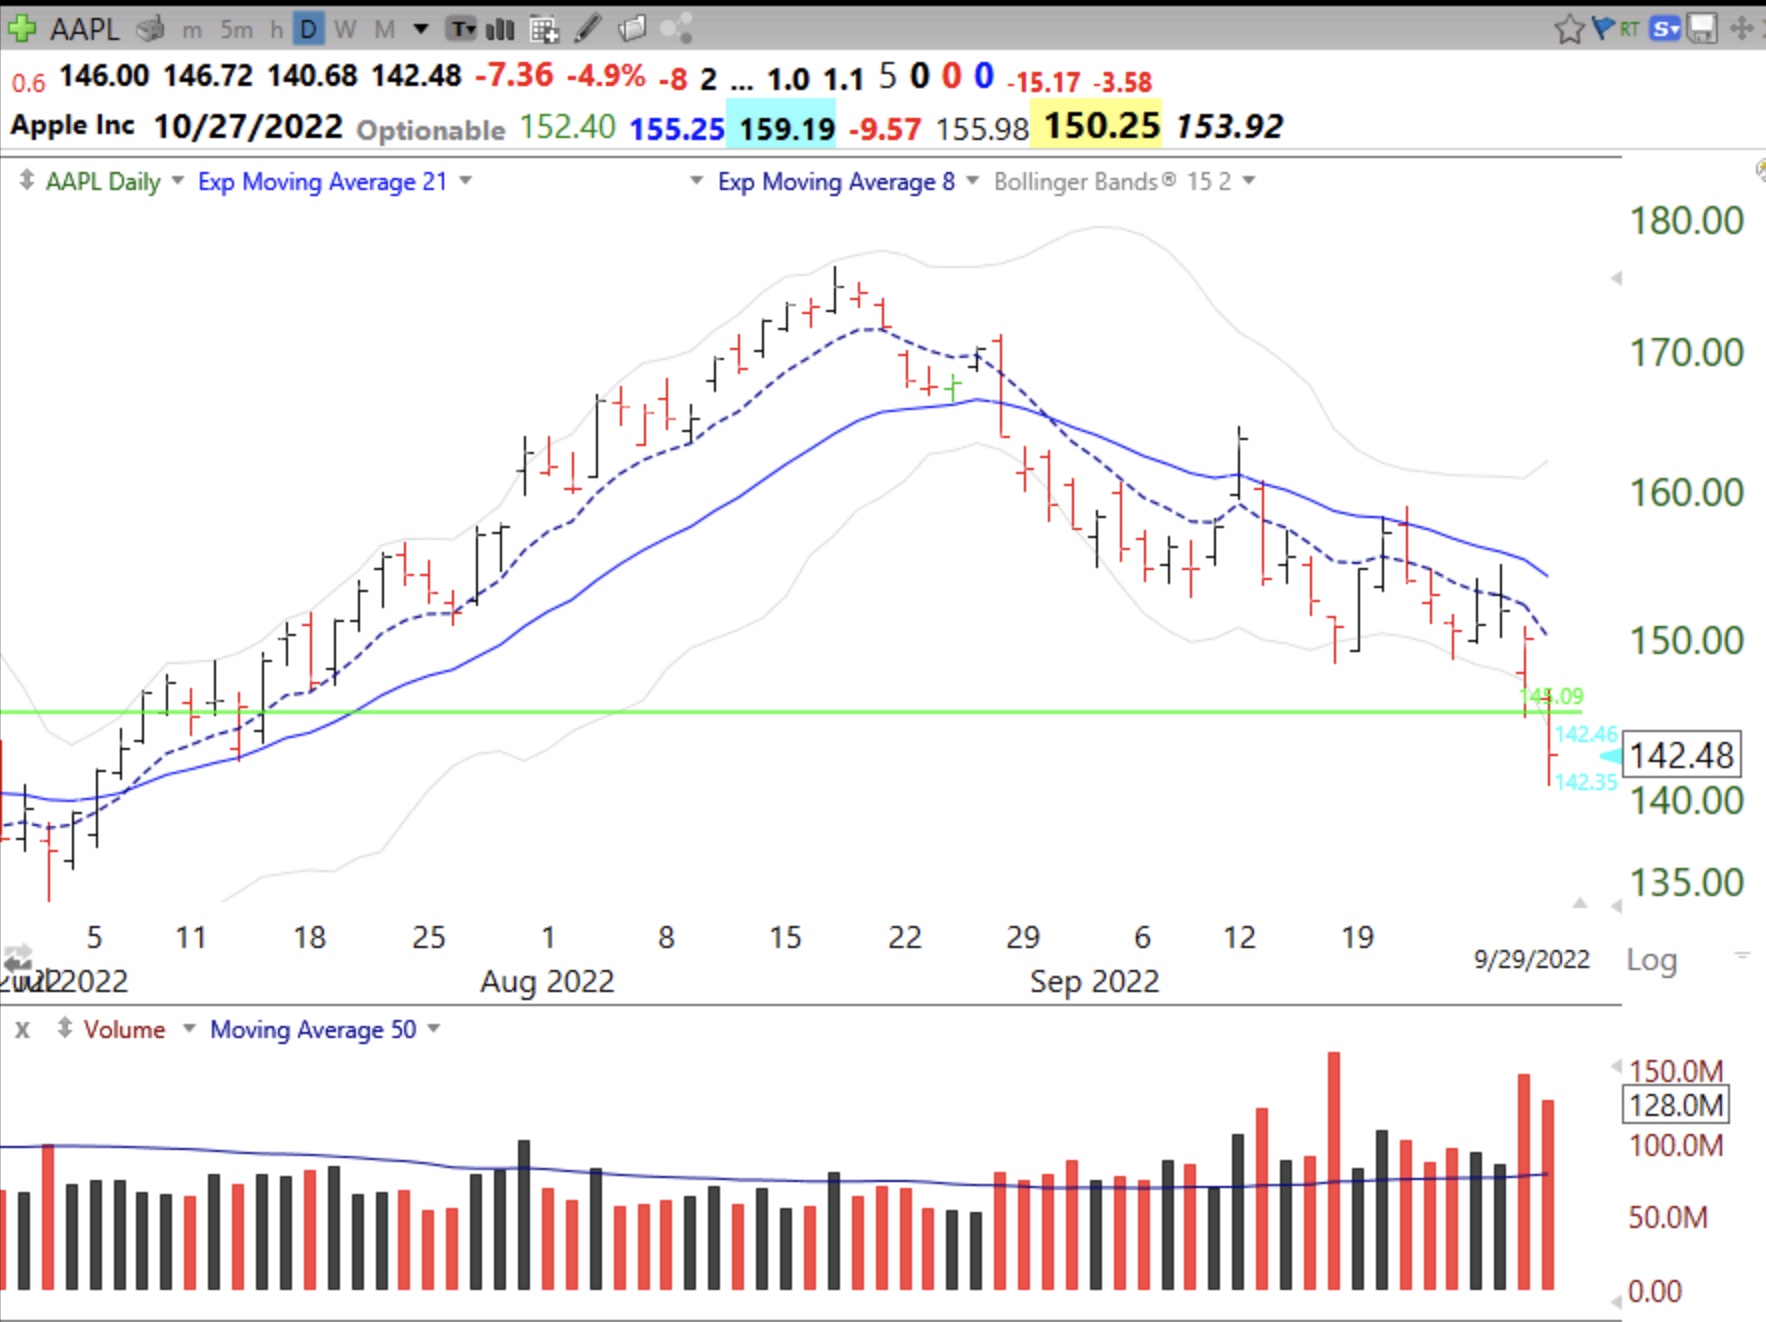
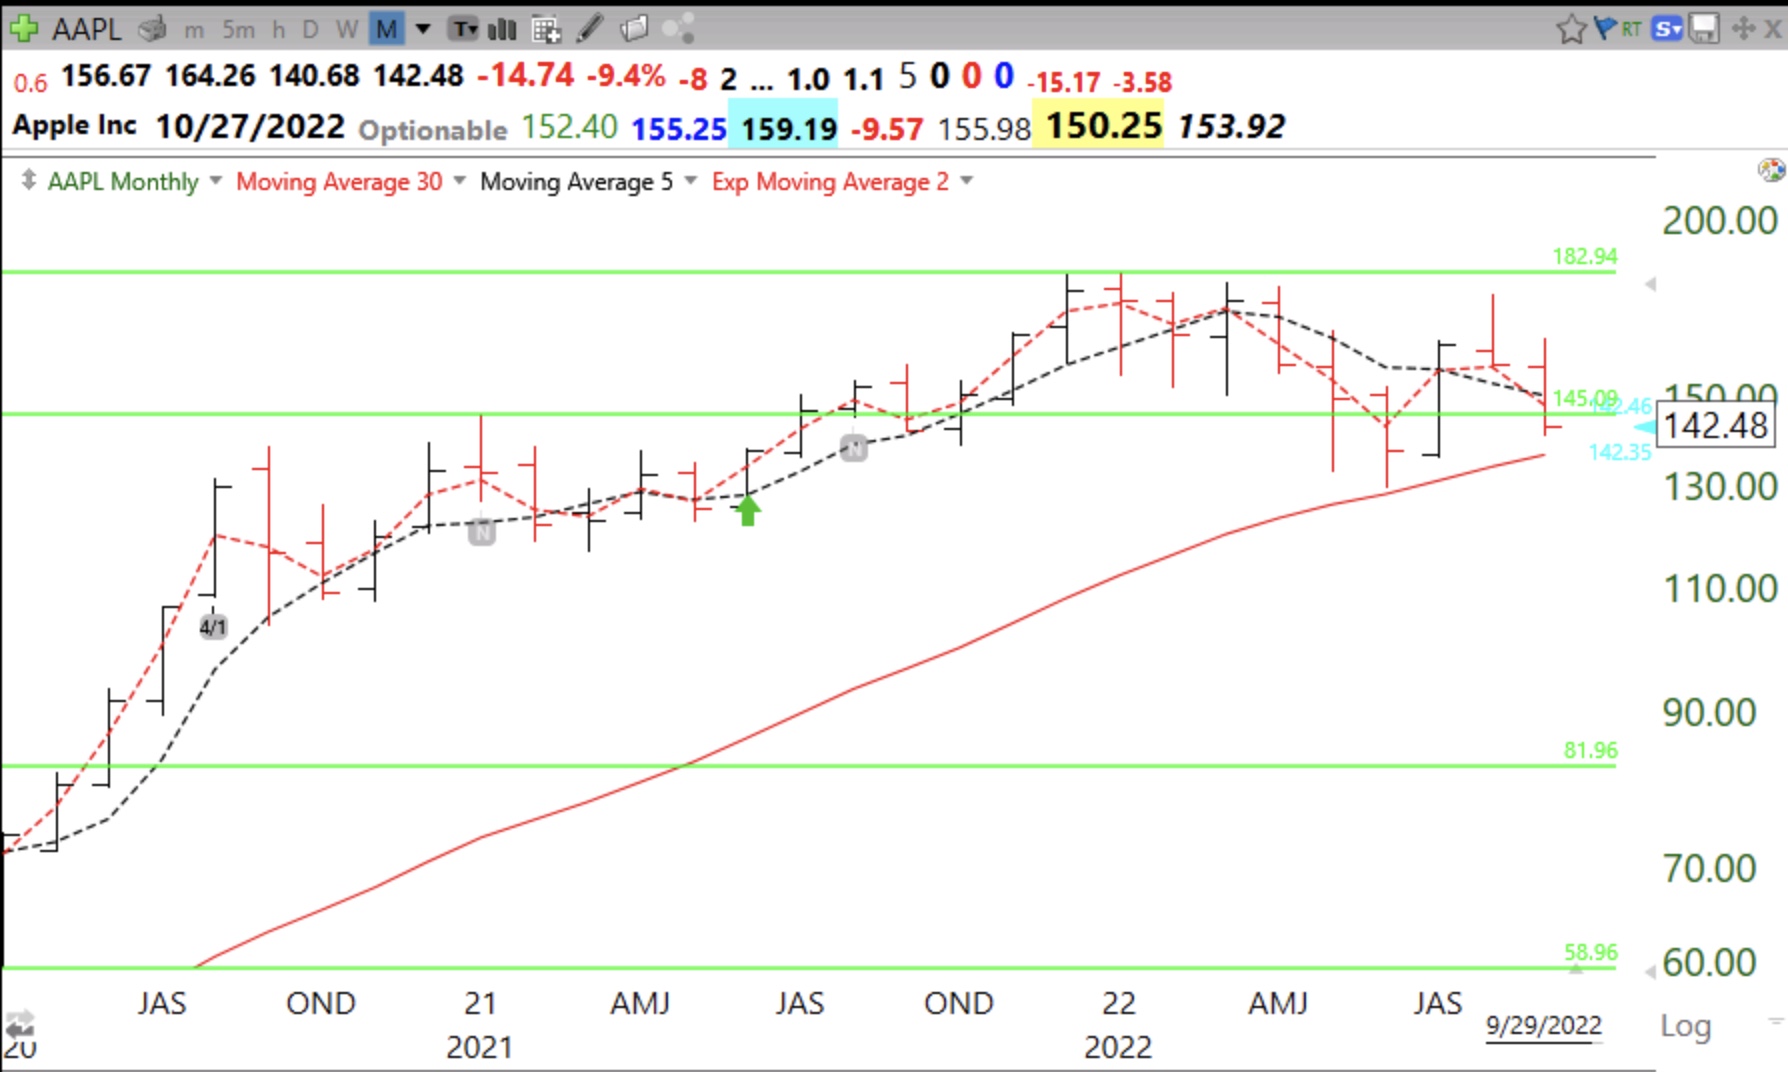
I use TC2000 to find stocks with a new price high (built in condition) the past few weeks and then manually draw in the green lines. There is no automatic way to draw them and I find it useful to review them manually.
Do you draw those green lines, or is there a formula in TC200 that you use, Dr Wish? I am new to your blog having watched your TraderLion session recently. C
I use TC2000 to find stocks with a new price high (built in condition) the past few weeks and then manually draw in the green lines. There is no automatic way to draw them and I find it useful to review them manually.