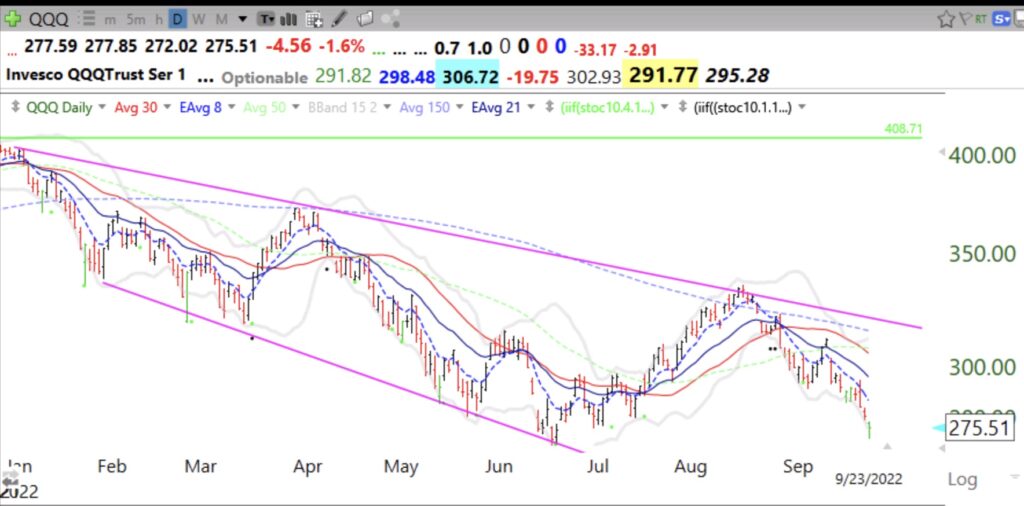
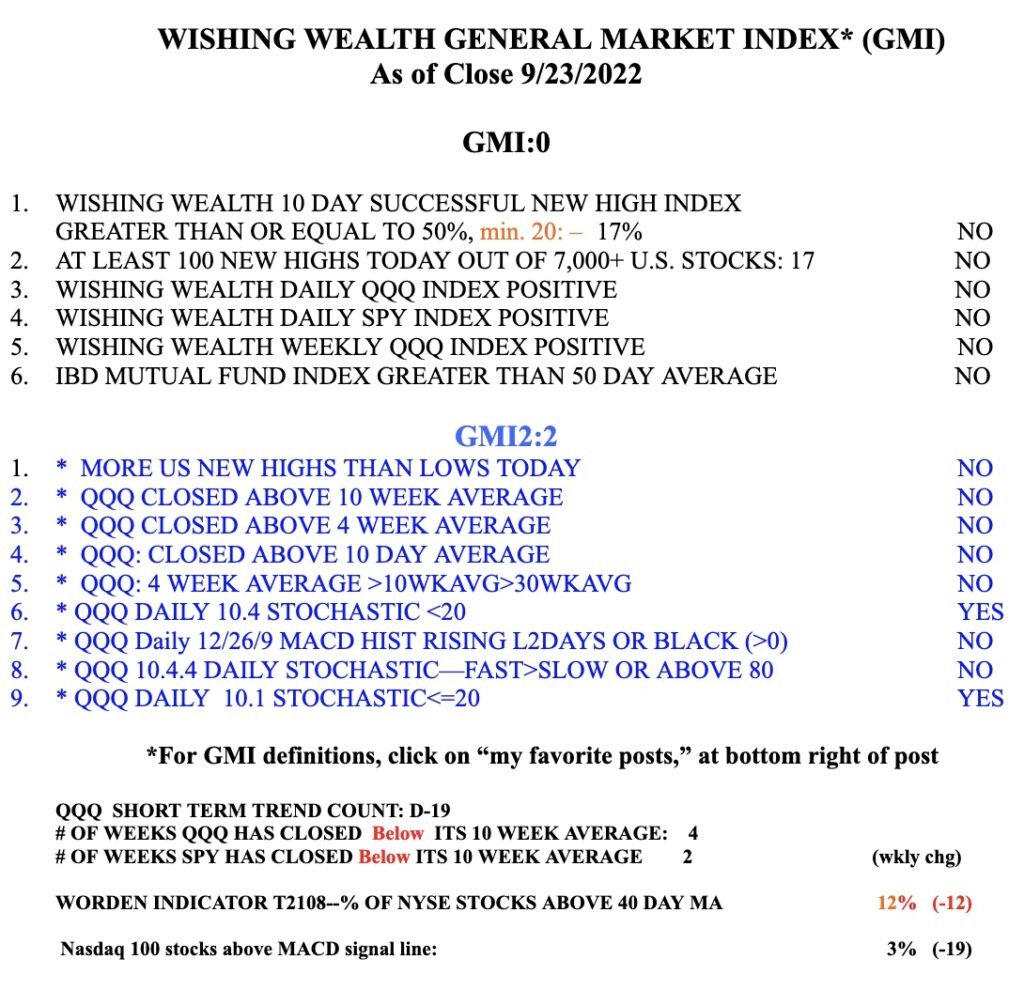
Friday’s indicators are very close to what occurred last June 16 when the QQQ bottomed and began a large rally. Will we get another tradable rally or will QQQ decline to hit that lower trend channel line or something else? No one knows but stocks often bounce during earnings season. These charts reveal the trend. First the daily…
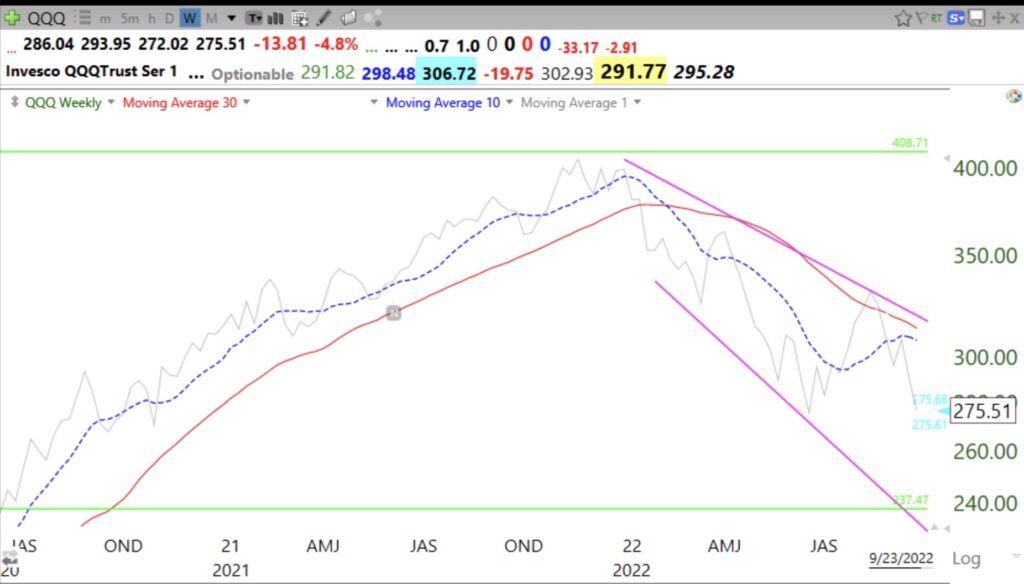
This weekly 10:30 chart provides another picture of the trend. QQQ is leading the two averages lower.
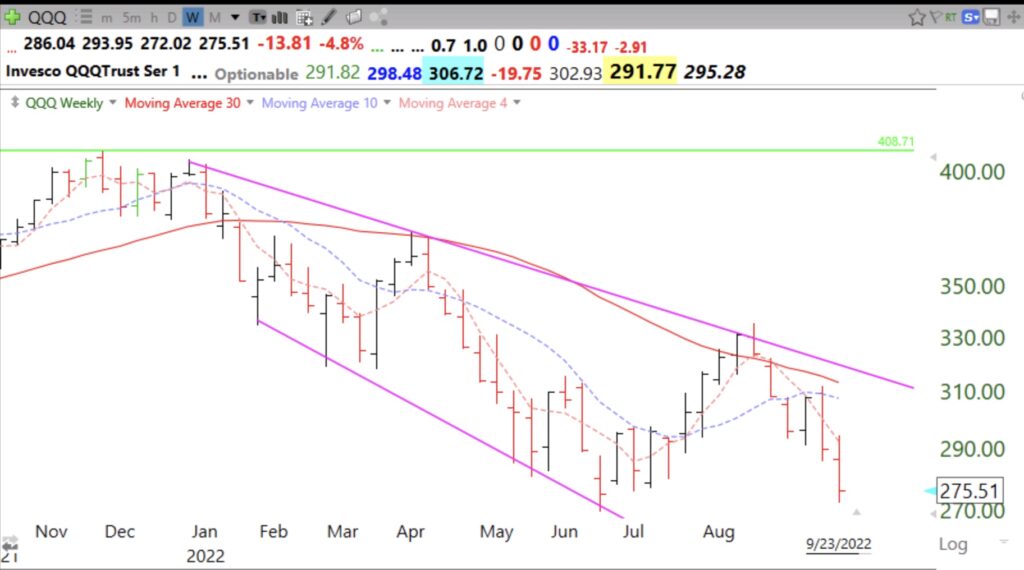
Finally, my favorite chart is a weekly chart displaying the 4,10, and 30 week averages. QQQ kissed the 4 wk avg. last week and continued down. Note how declines tend to ride the declining 4wk average (red dotted) down. When a real market turn comes, QQQ will close above the 4wk then the 10 wk and then the 30 wk averages which will then begin to turn up. Until that happens, the down-trend is not over. Trend followers react after the desired signals appear, not before.
When the GMI=0, it is probably best to go short or go fishing….


Thanks for this wonderfull article.
Thank you!