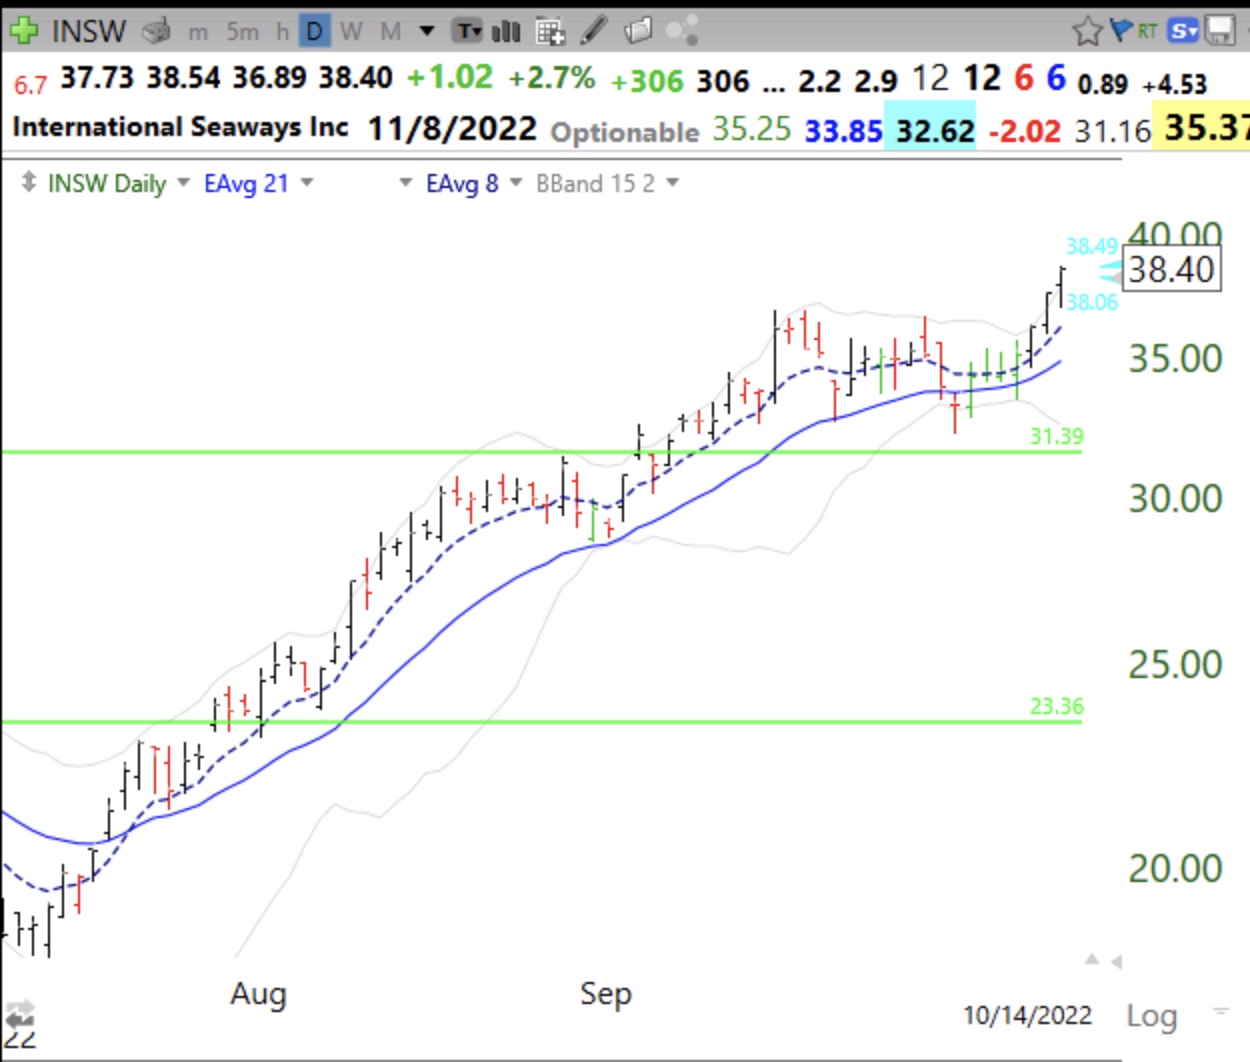
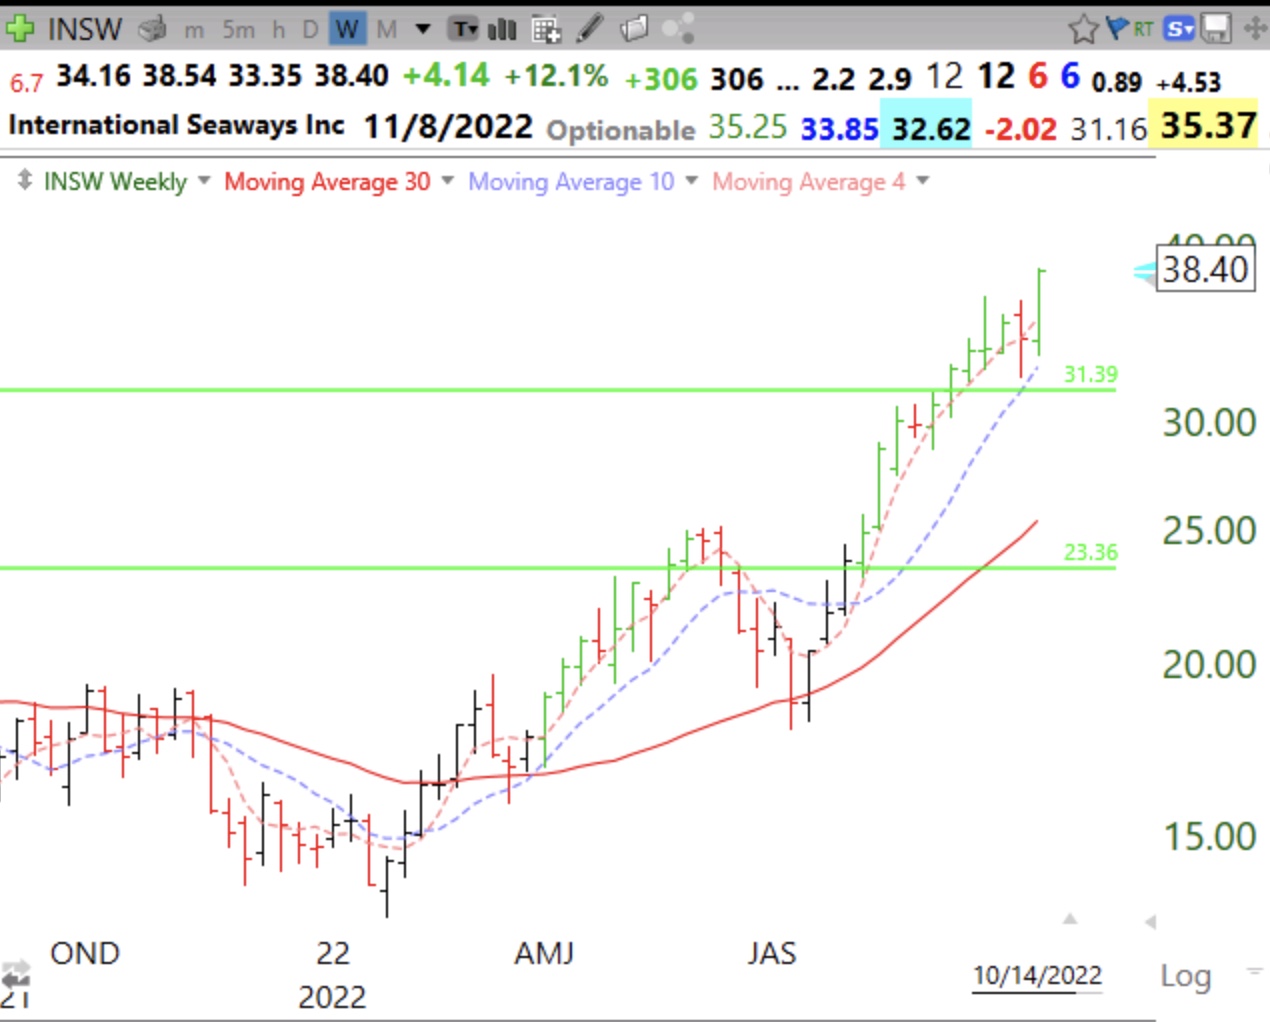
This daily chart shows the 8 ema (dotted line) and 21 ema. Note that the 8 crossed above the 21 last July and has remained above it since. This crossover could be a potential set-up as long as the stock is in a Stage 2 up-trend, which the weekly chart confirms. Note the weekly chart shows 4wk avg>10wk avg> 30 wk avg, a strong Stage 2 pattern. Note the series of weekly green bars indicating a bounce up off of the rising 4 wk avg.
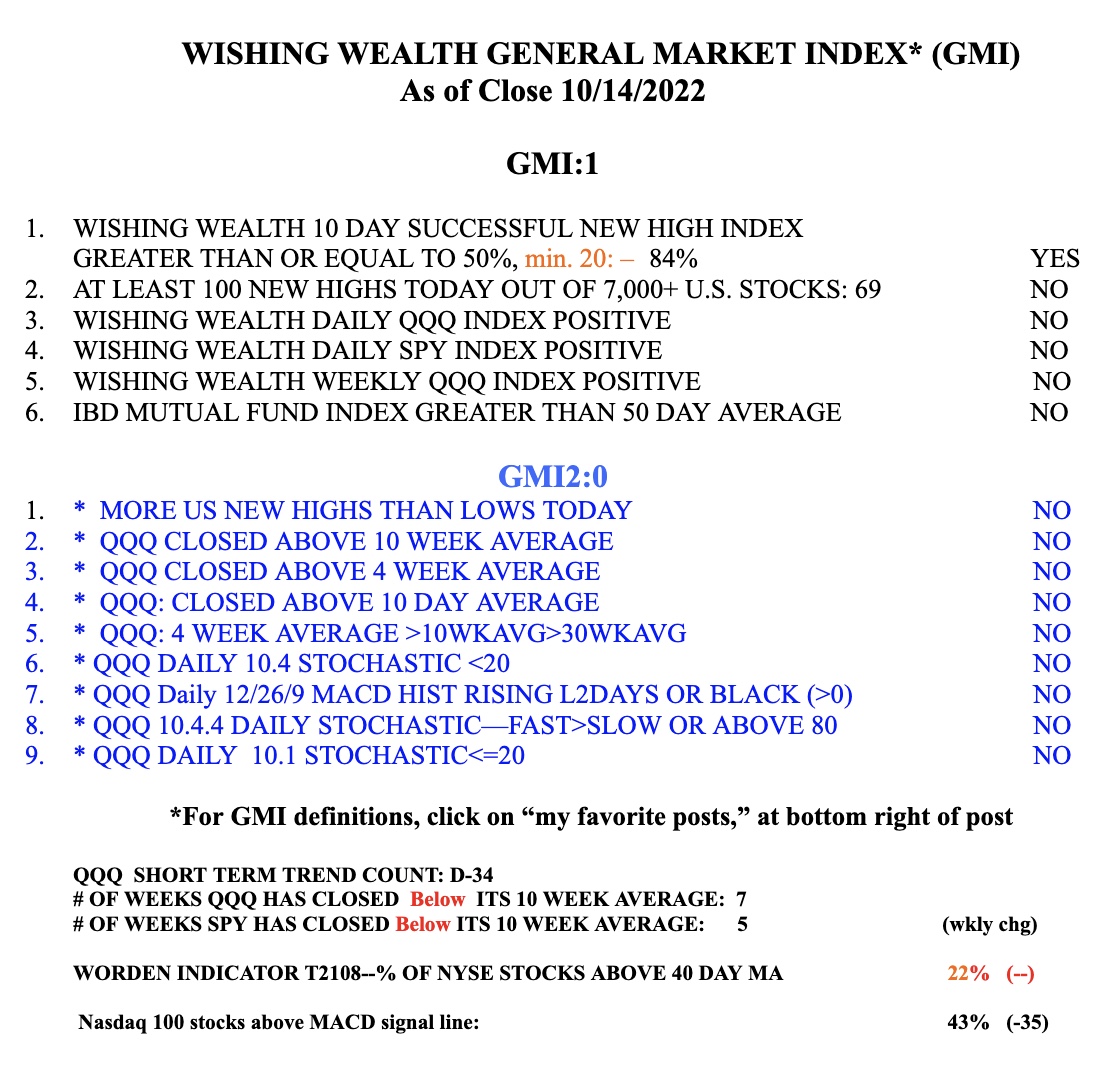
GMI remains RED and registers 1 (of 6).