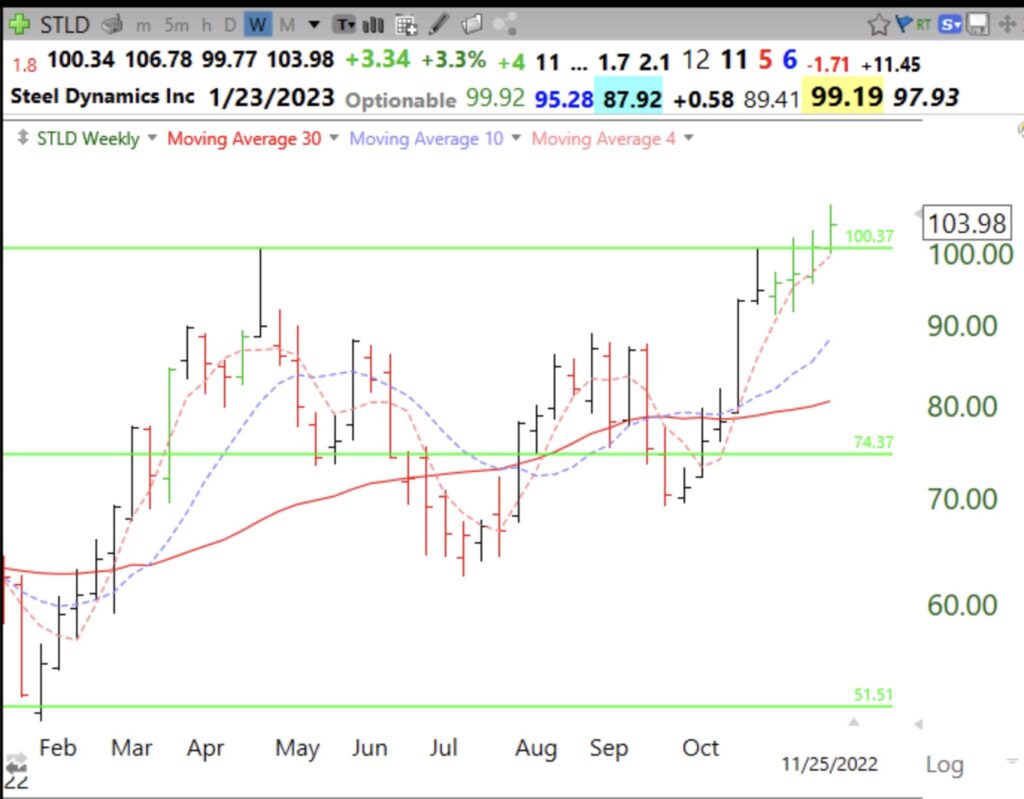
Weekly green bar is drawn on a weekly chart when the stock had 4wk>10wk>30wk average and bounced up off of the rising 4 week average (pink dotted line). If I owned STLD I would place a stop just below last week’s low of 99.77 or sell if it closed back below its green line (at 100.37). The GLB (green line break-out) means the stock broke out to an ATH after consolidating for at least 3 months after its last ATH (here, last April).
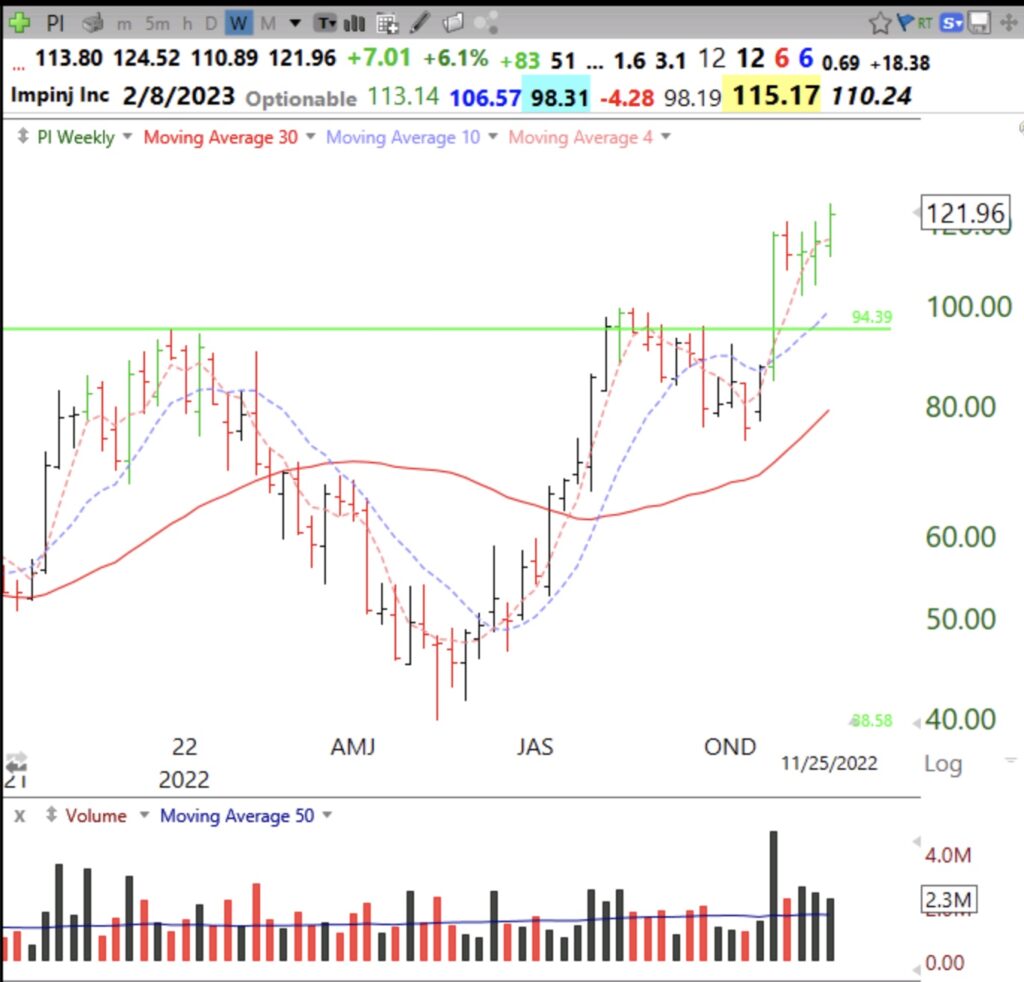
 PI also had a weekly green bar last week after its recent GLB. Note the huge volume on its GLB week. Cup and handle too?
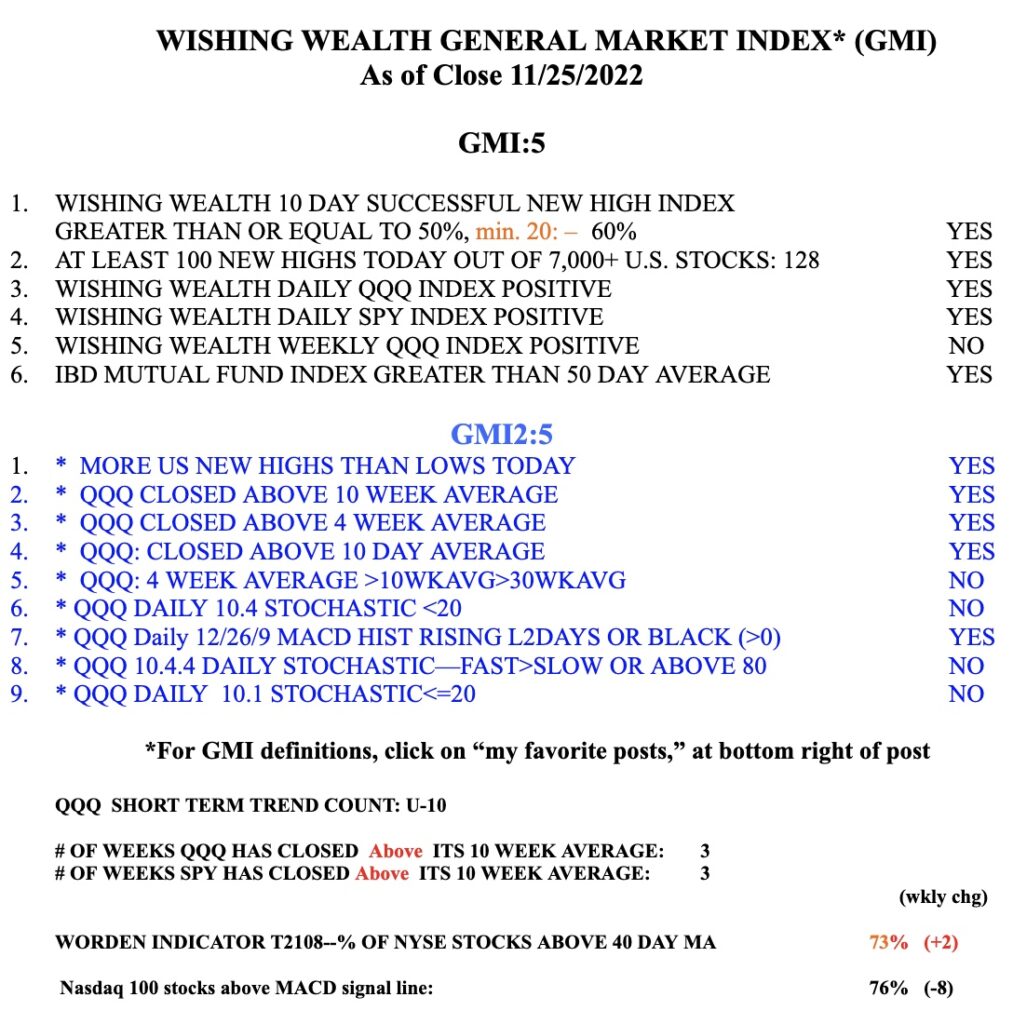
The GMI remains Green, at 5 (of 6).


Hi Dr. Wish:
I looked at the volume for STLD each day last week and for the week in total and it didn’t seem to be significant. Would you still buy it without a volume burst? Thanks.
STLD had a high volume bounce up off its green line on 11/30. That could have been a set-up but it did just hold last week. See if Friday’s low holds this week.