2 thoughts on “Blog Post: Day 19 of $QQQ short term up-trend; Indexes survive test of 30 day average and bounce from oversold; $DXCM breaks out after VCP, see chart”
Hi Dr. Wish:
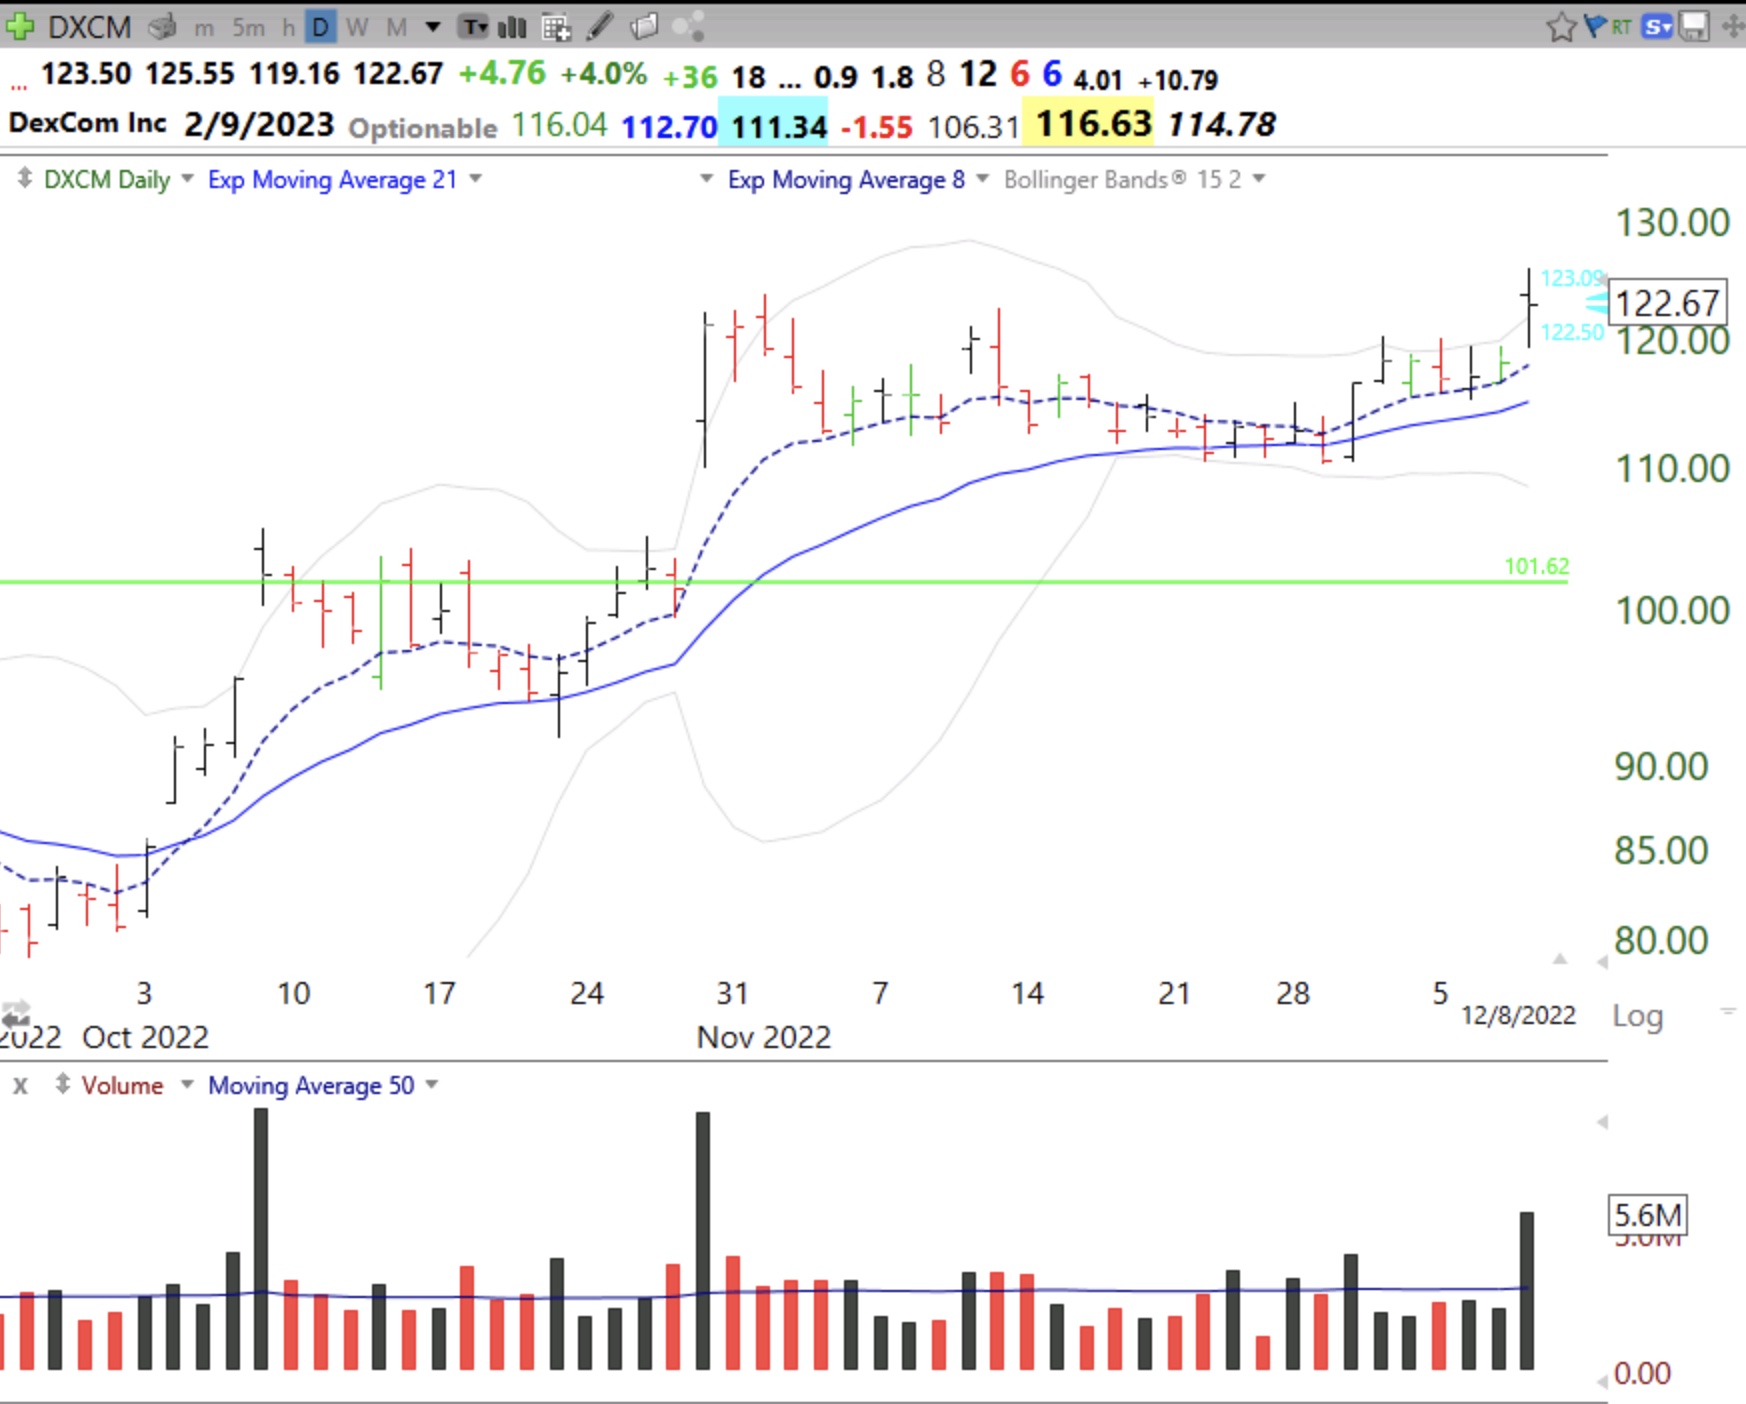
Looking at the monthly chart for DXCM, I can’t see why 101.62 is a green line? It looks like there would have been a green line at 114.06 in Aug 2020 and 164.86 in Nov 2021.
Also, what does green line “top” of 164.86 mean? Is that where you would sell if you bought it now?
Thanks.
Loading...
Thank you. I corrected my post. DXCM is not near its green line top. I would only buy it if it breaks through its historical peak of $164.86.
Hi Dr. Wish:
Looking at the monthly chart for DXCM, I can’t see why 101.62 is a green line? It looks like there would have been a green line at 114.06 in Aug 2020 and 164.86 in Nov 2021.
Also, what does green line “top” of 164.86 mean? Is that where you would sell if you bought it now?
Thanks.
Thank you. I corrected my post. DXCM is not near its green line top. I would only buy it if it breaks through its historical peak of $164.86.