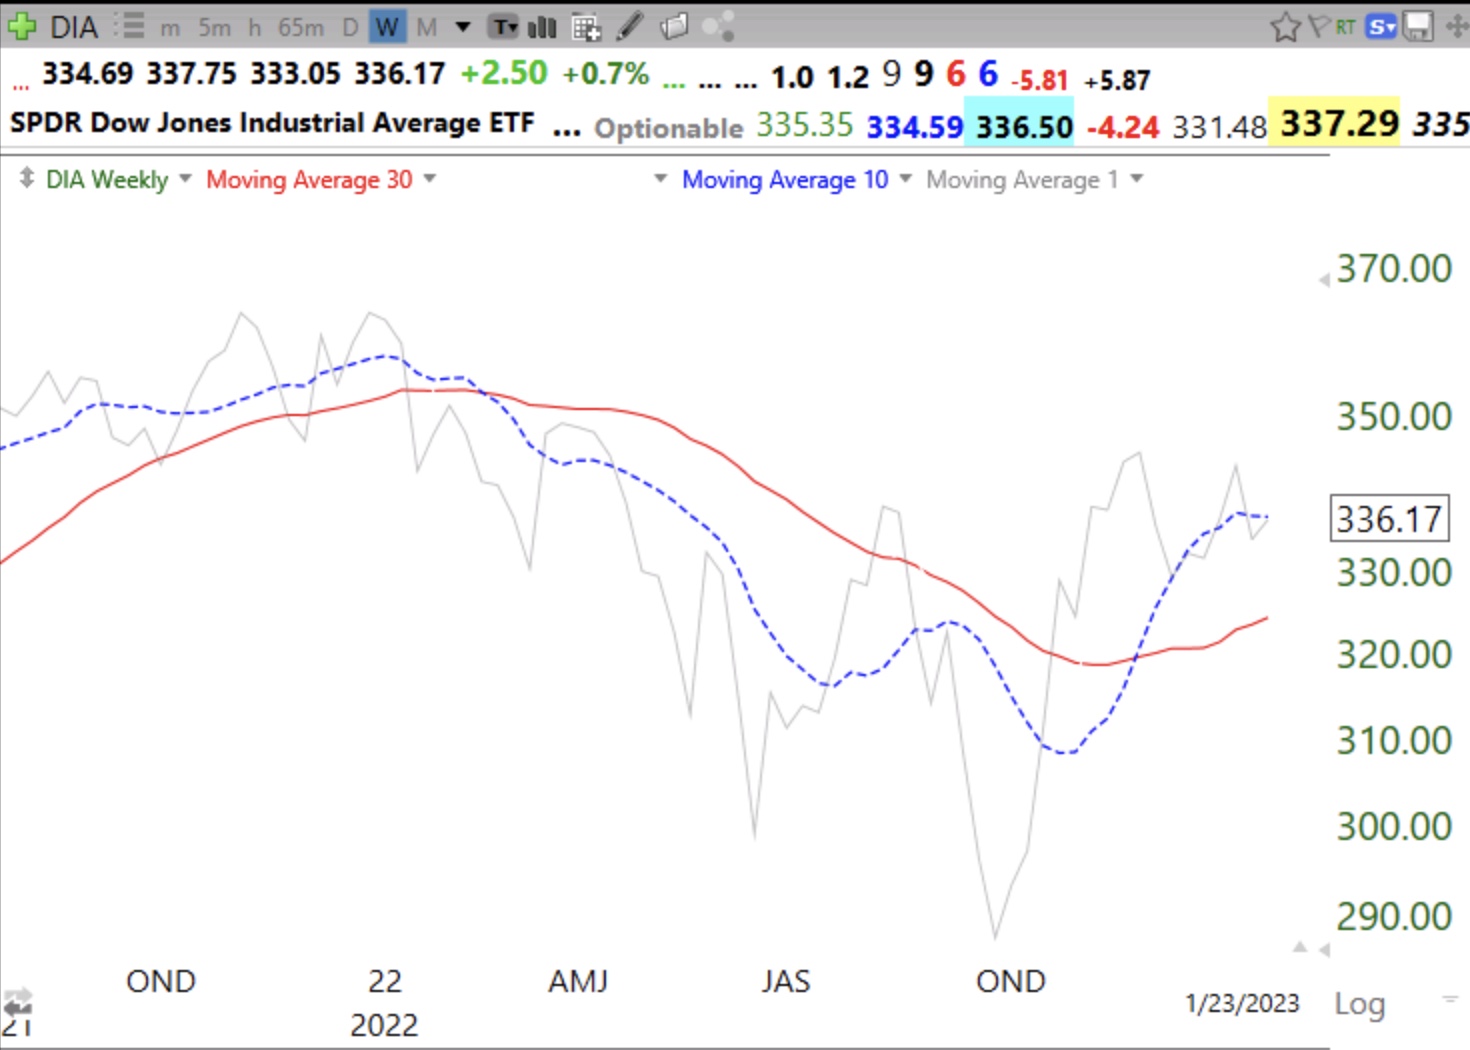
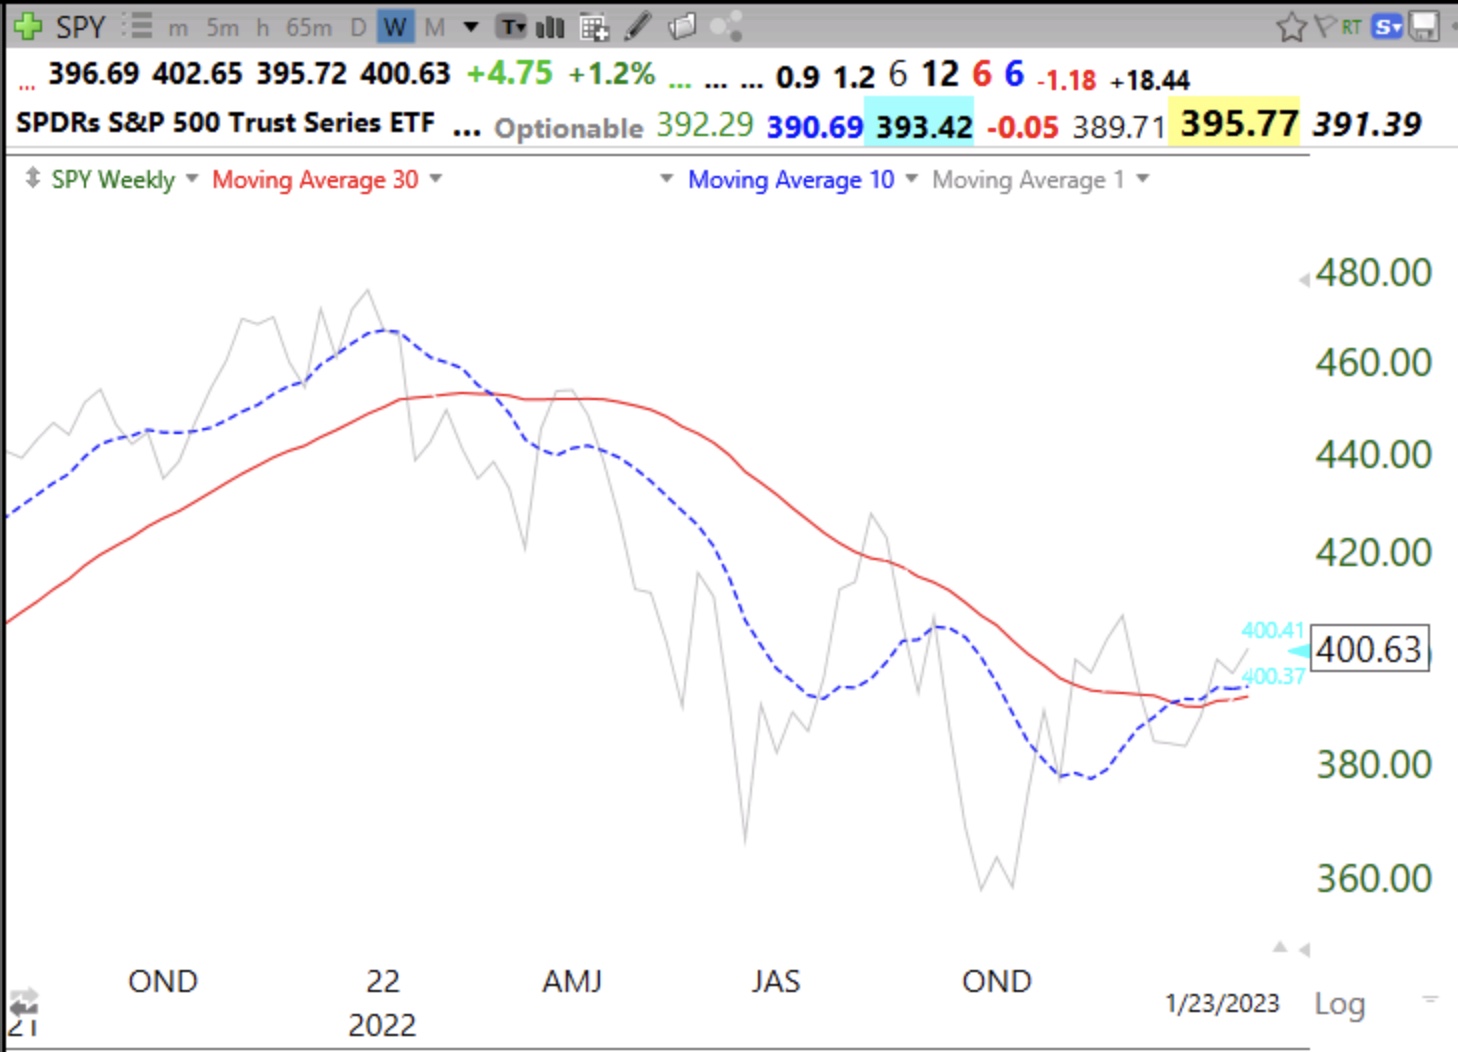
Weekly 10:30 chart is a good indicator of the market’s long term trend. When the 10 week average climbs above the 30 week the bear market is likely over. This has happened for DIA and SPY. However, as this chart shows, QQQ is not there yet. 10 week average is dotted line. Solid gray line is weekly close. QQQ has just closed above its 30 week average (red line) and needs to stay there to bring the 10 week above.