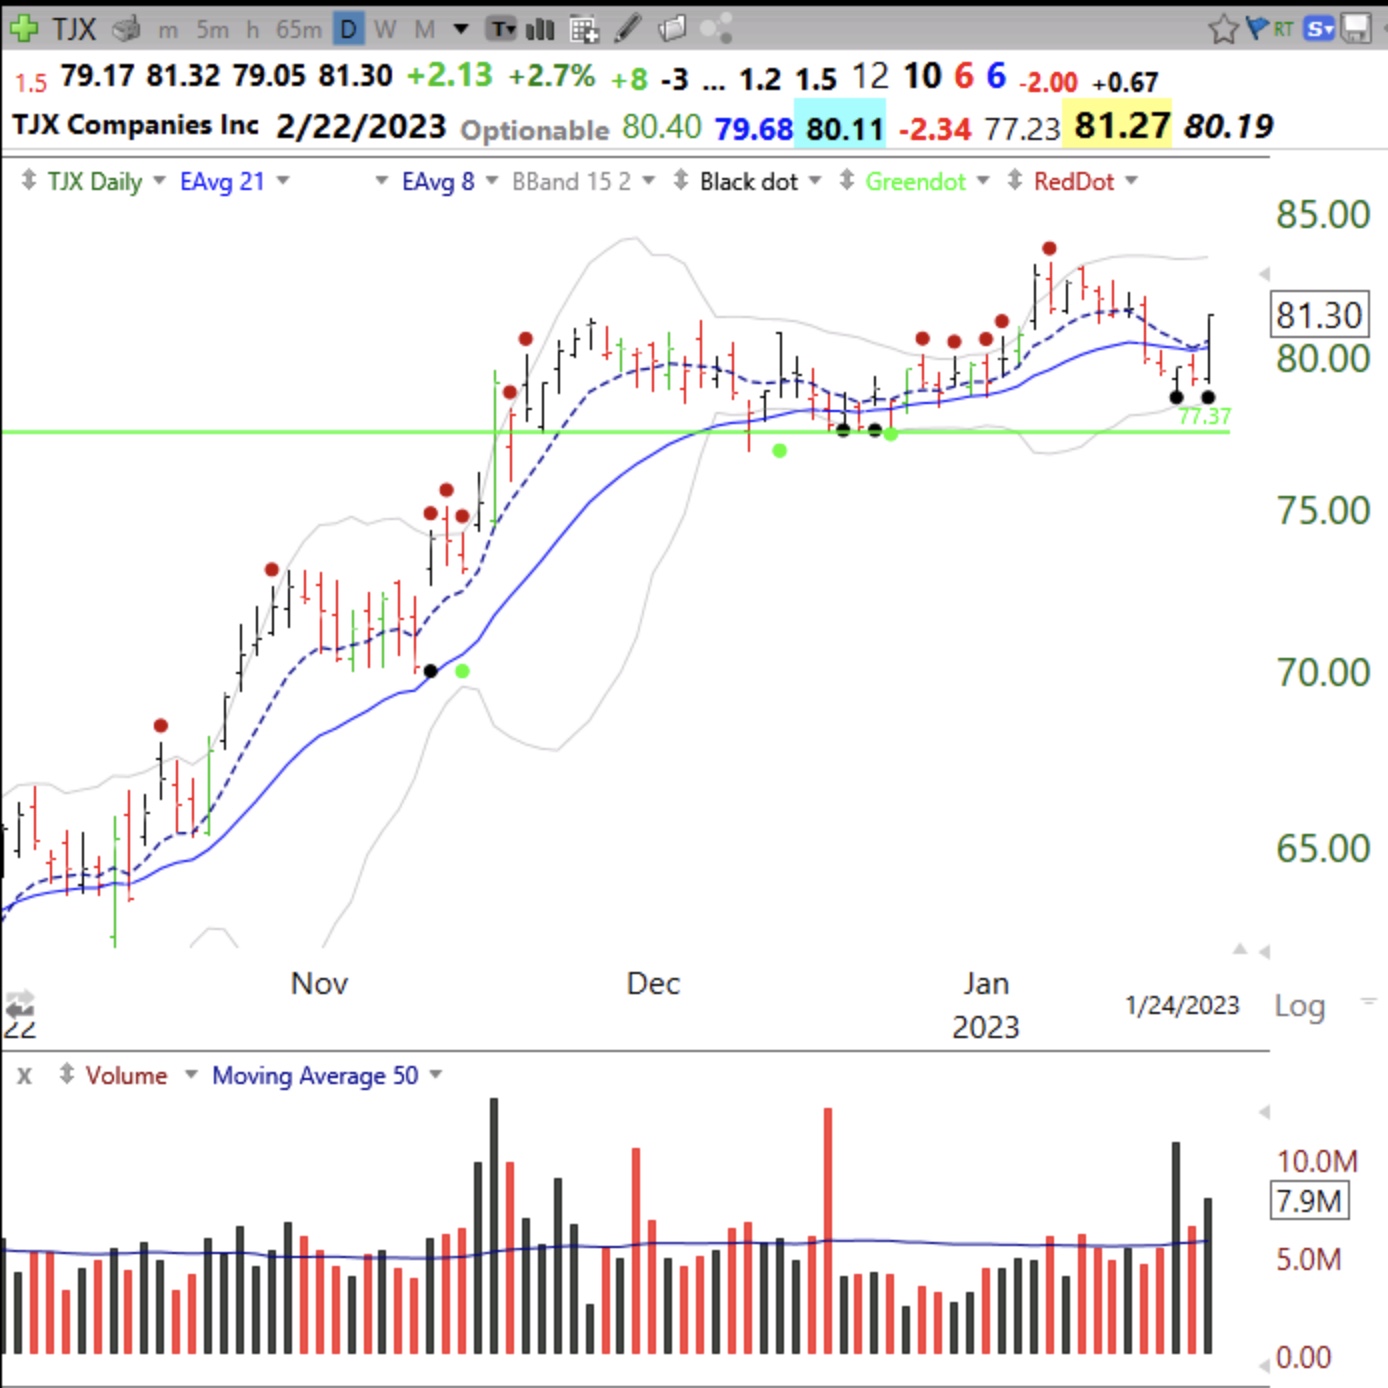
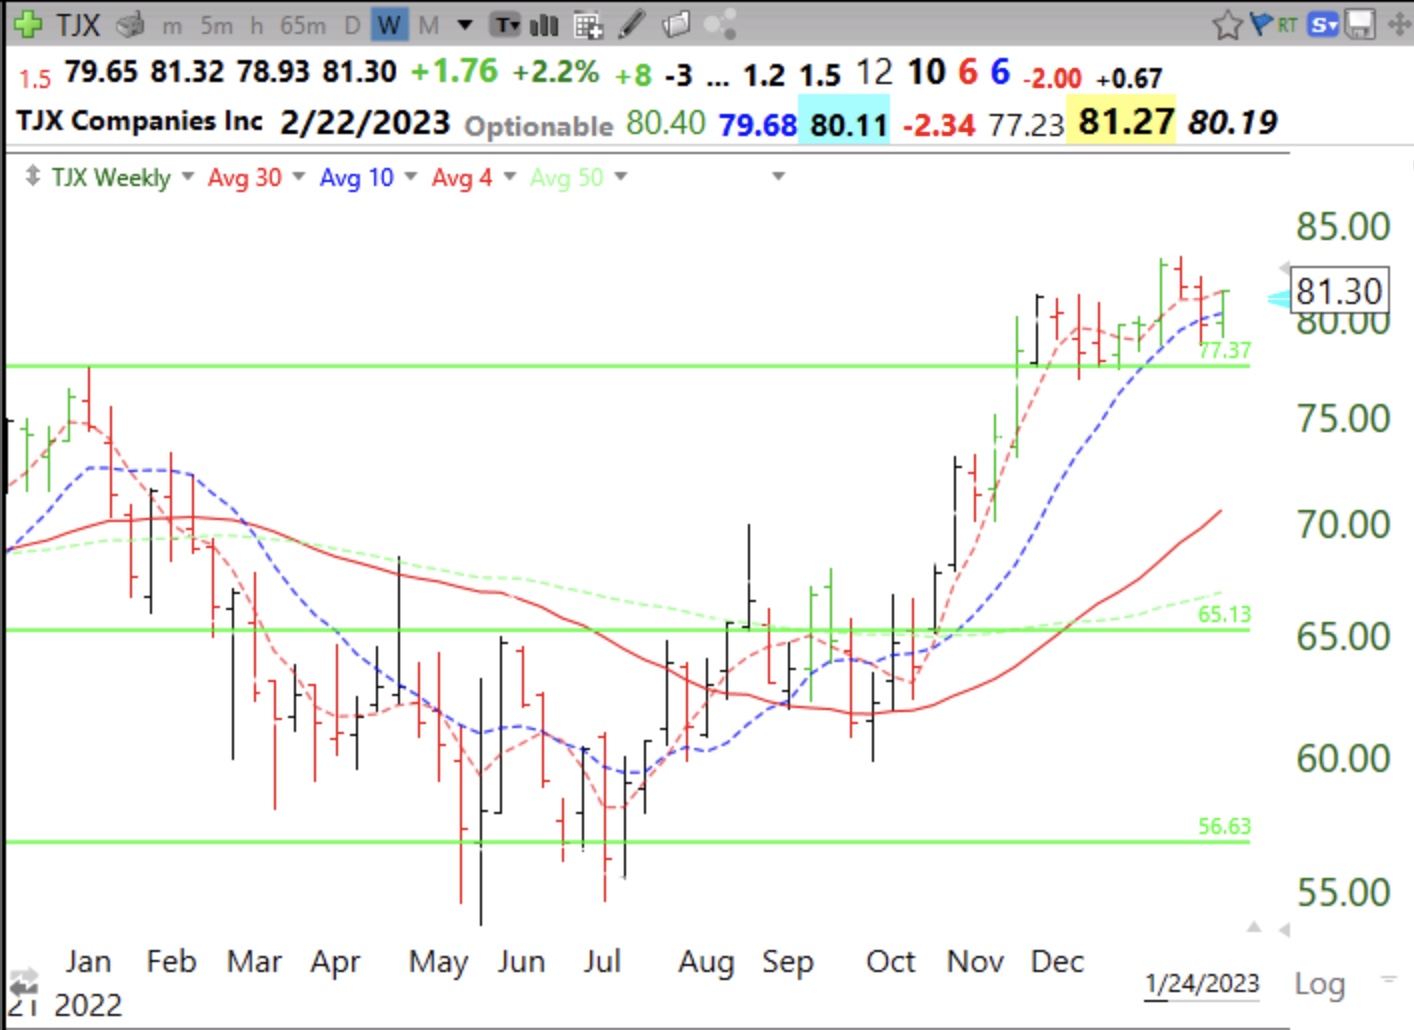
TJX came up on one of my TC2000 scans looking for a stock at a recent ATH that is bouncing off of support or oversold. TJX had a GLB (green line break-out) on November 16 and then went sideways finding support around the green line. It never closed back below the green line. Today TJX closed above its exp21 day average (purple solid line) on higher volume and had recent black dots indicating oversold. If I bought this set-up I would place an immediate sell stop below the recent low. Its composite rating is only 85 but Fidelity Contrafund has a position. It has a nice weekly chart with the avg4>avg10>avg30 and a weekly green bar. While set-ups can give me an edge, I must always have an exit strategy that minimizes potential losses.
Hi Dr. Wish ,
Any idea why we have all the weird candles on the 24th of Jan with LLY, MRK , WMT, especially LLY and MRK, looks like volume was not the cause to me but I would love your opinion .
Thank you for what you do , I have a whole strategy dedicated to trading stuff above or at GLB meeting a certain range of criteria and it gave me a positive expectancy even in 2022 ~
Thank you sir .