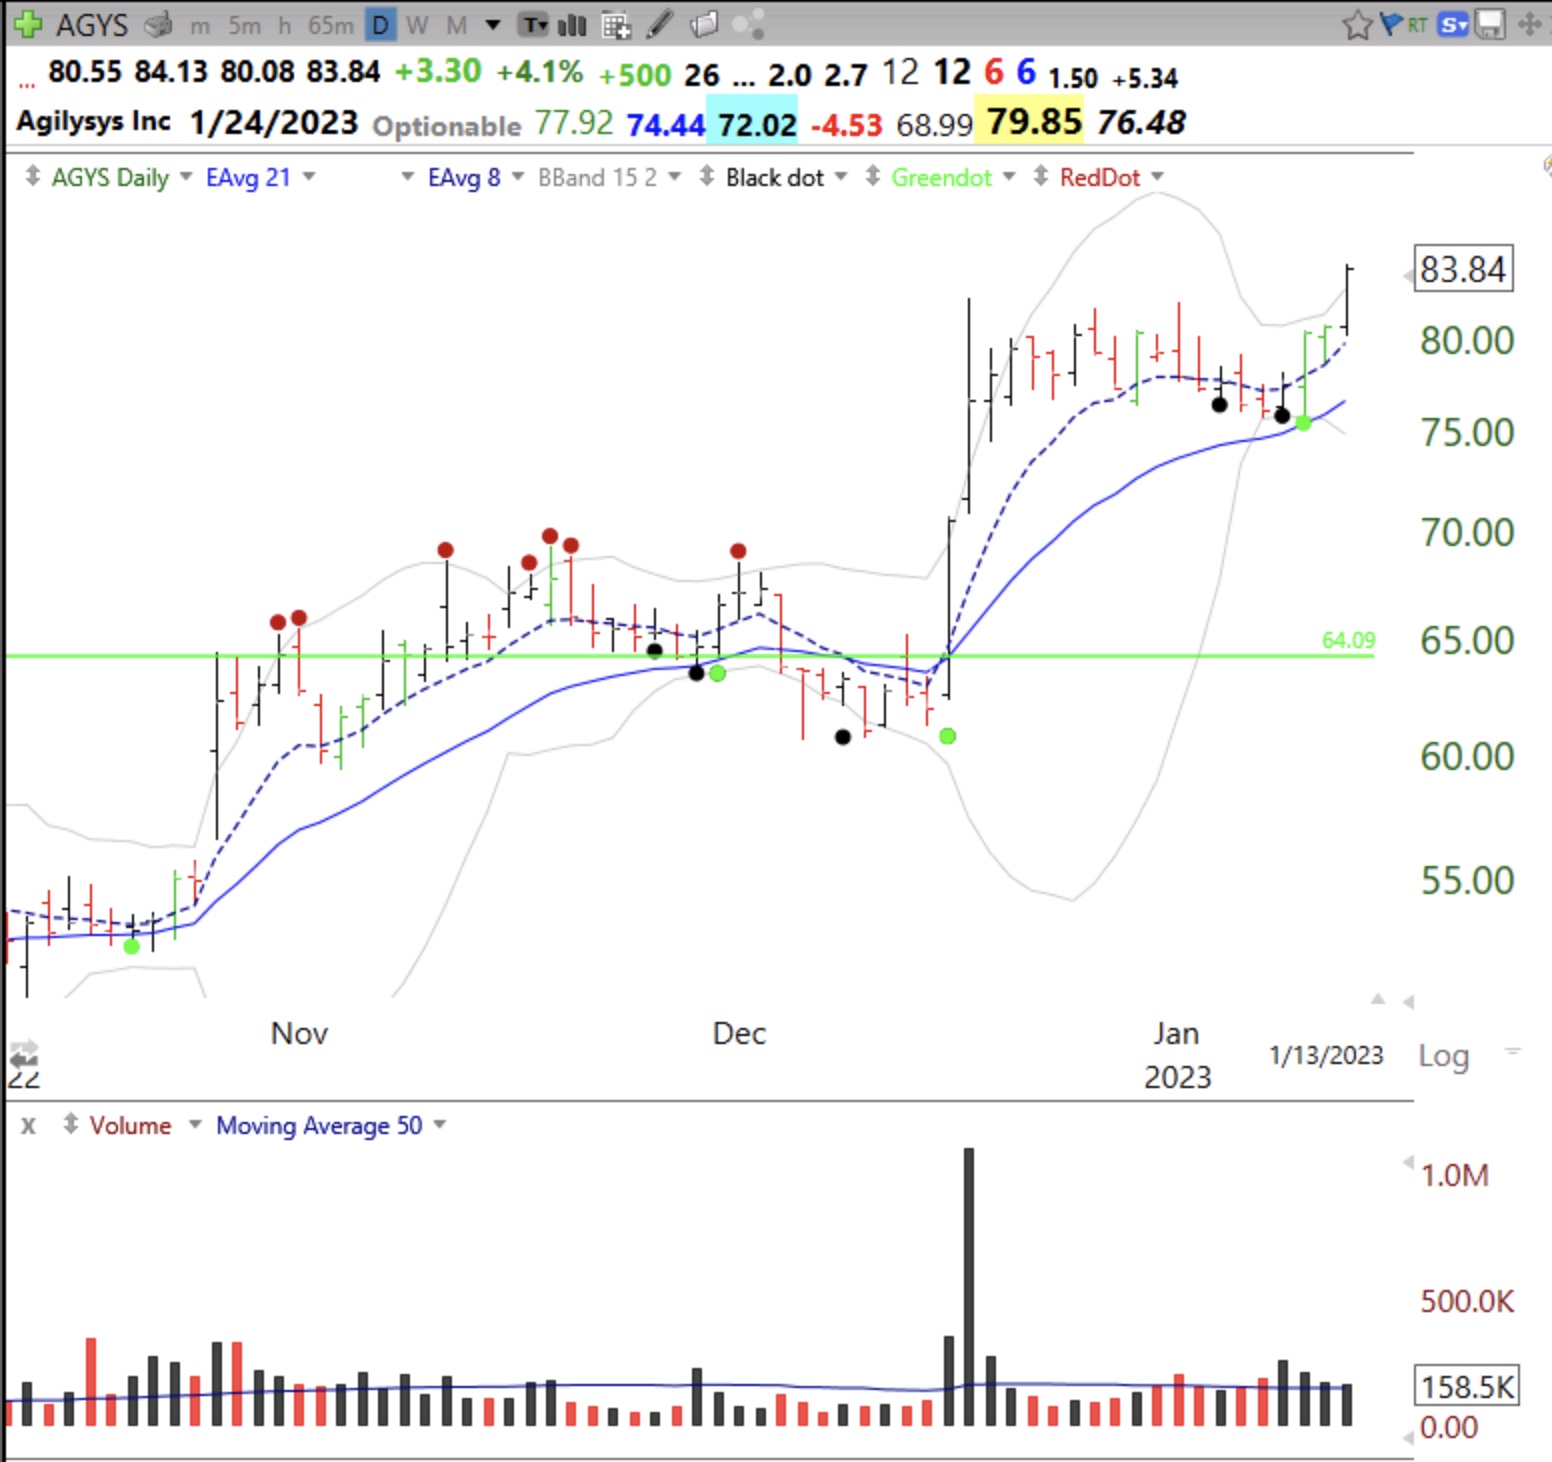
With its second consecutive day above 3, the GMI flashes a Green signal. Set-ups are beginning to work out. However, I am much more confident of the market’s new up-trend when the GMI=6. But it may take a while for the remaining 2 components of the GMI to turn positive. However, with the QQQ short term trend now up, I have started to accumulate some TQQQ in my trading IRA. Now that the media pundits are talking up dividend stocks, it may be time to go back into growth stocks?
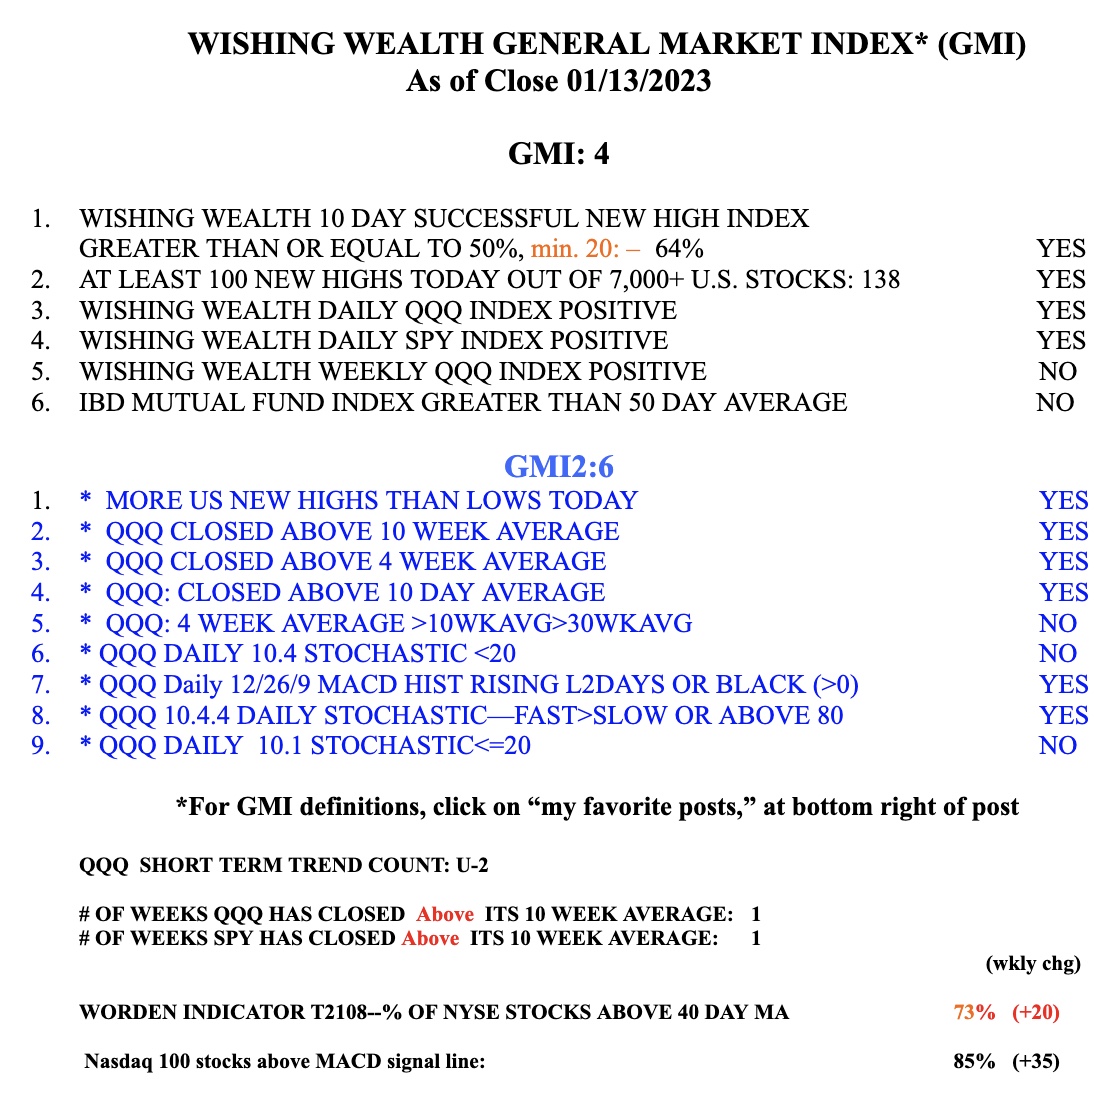
You know that I (and Nicolas Darvas and many leading traders) mainly buy stocks breaking out to an ATH after a period of consolidation. That is why I developed the green line break-out (GLB) set-up. I draw a green line on a monthly chart at the highest price bar ever reached after that bar has not been exceeded for at least 3 months (3 bars). I may or may not buy the stock the day it goes through the green line and closes at a new ATH. But one does not have to buy the stock on the day of the GLB. One alternative is to buy it after the GLB when it becomes oversold. Here is an example.
This monthly chart shows ACLX had a GLB in December. The green line was drawn at $26.91.
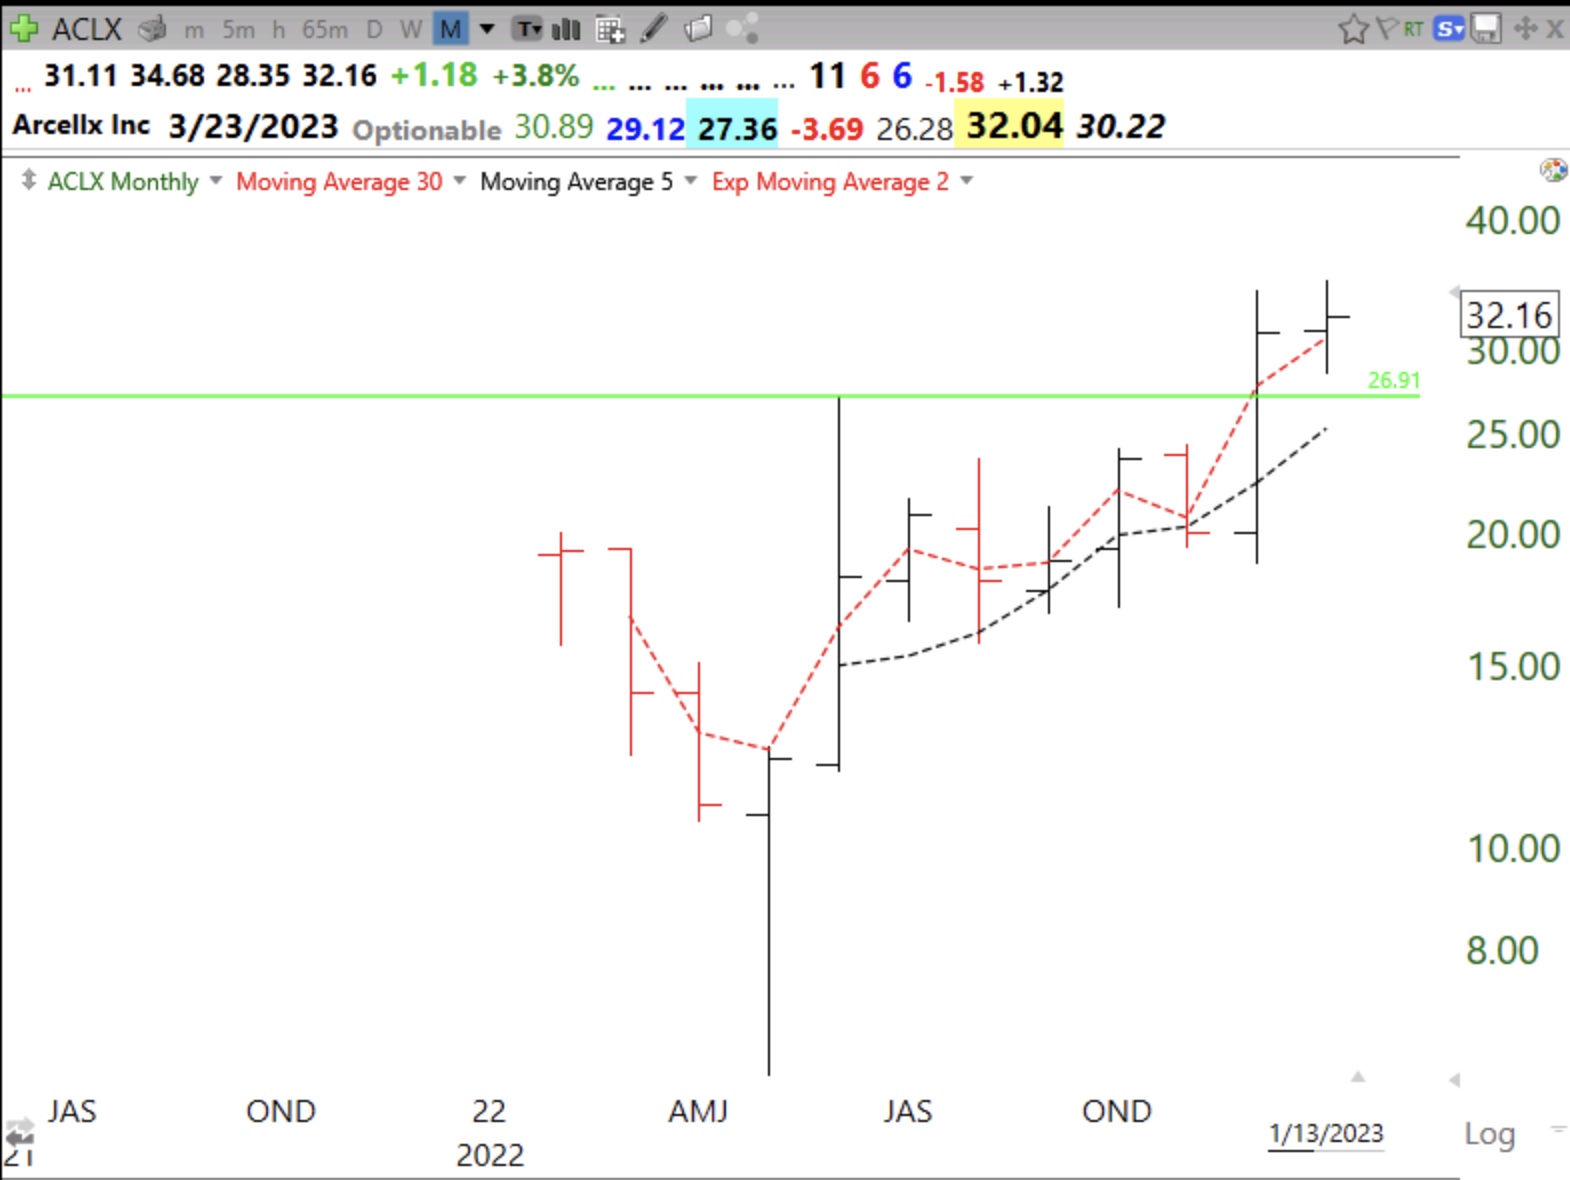
The daily chart shows the GLB on December 9. The next day it traded below the green line but closed the day above it. That is why I sell a GLB only if the stock closes a day back below the green line. Note the gap and huge volume on the day of the GLB. If I did not buy the day of the gap, I could wait until the stock has an oversold bounce (OSB). The OSB is signified by the black dot. If one bought on the day of the bounce s/he could place a stop loss order right below the low of the bounce day, hopefully ensuring a small loss if it failed. Or one could wait for a close below the green line.
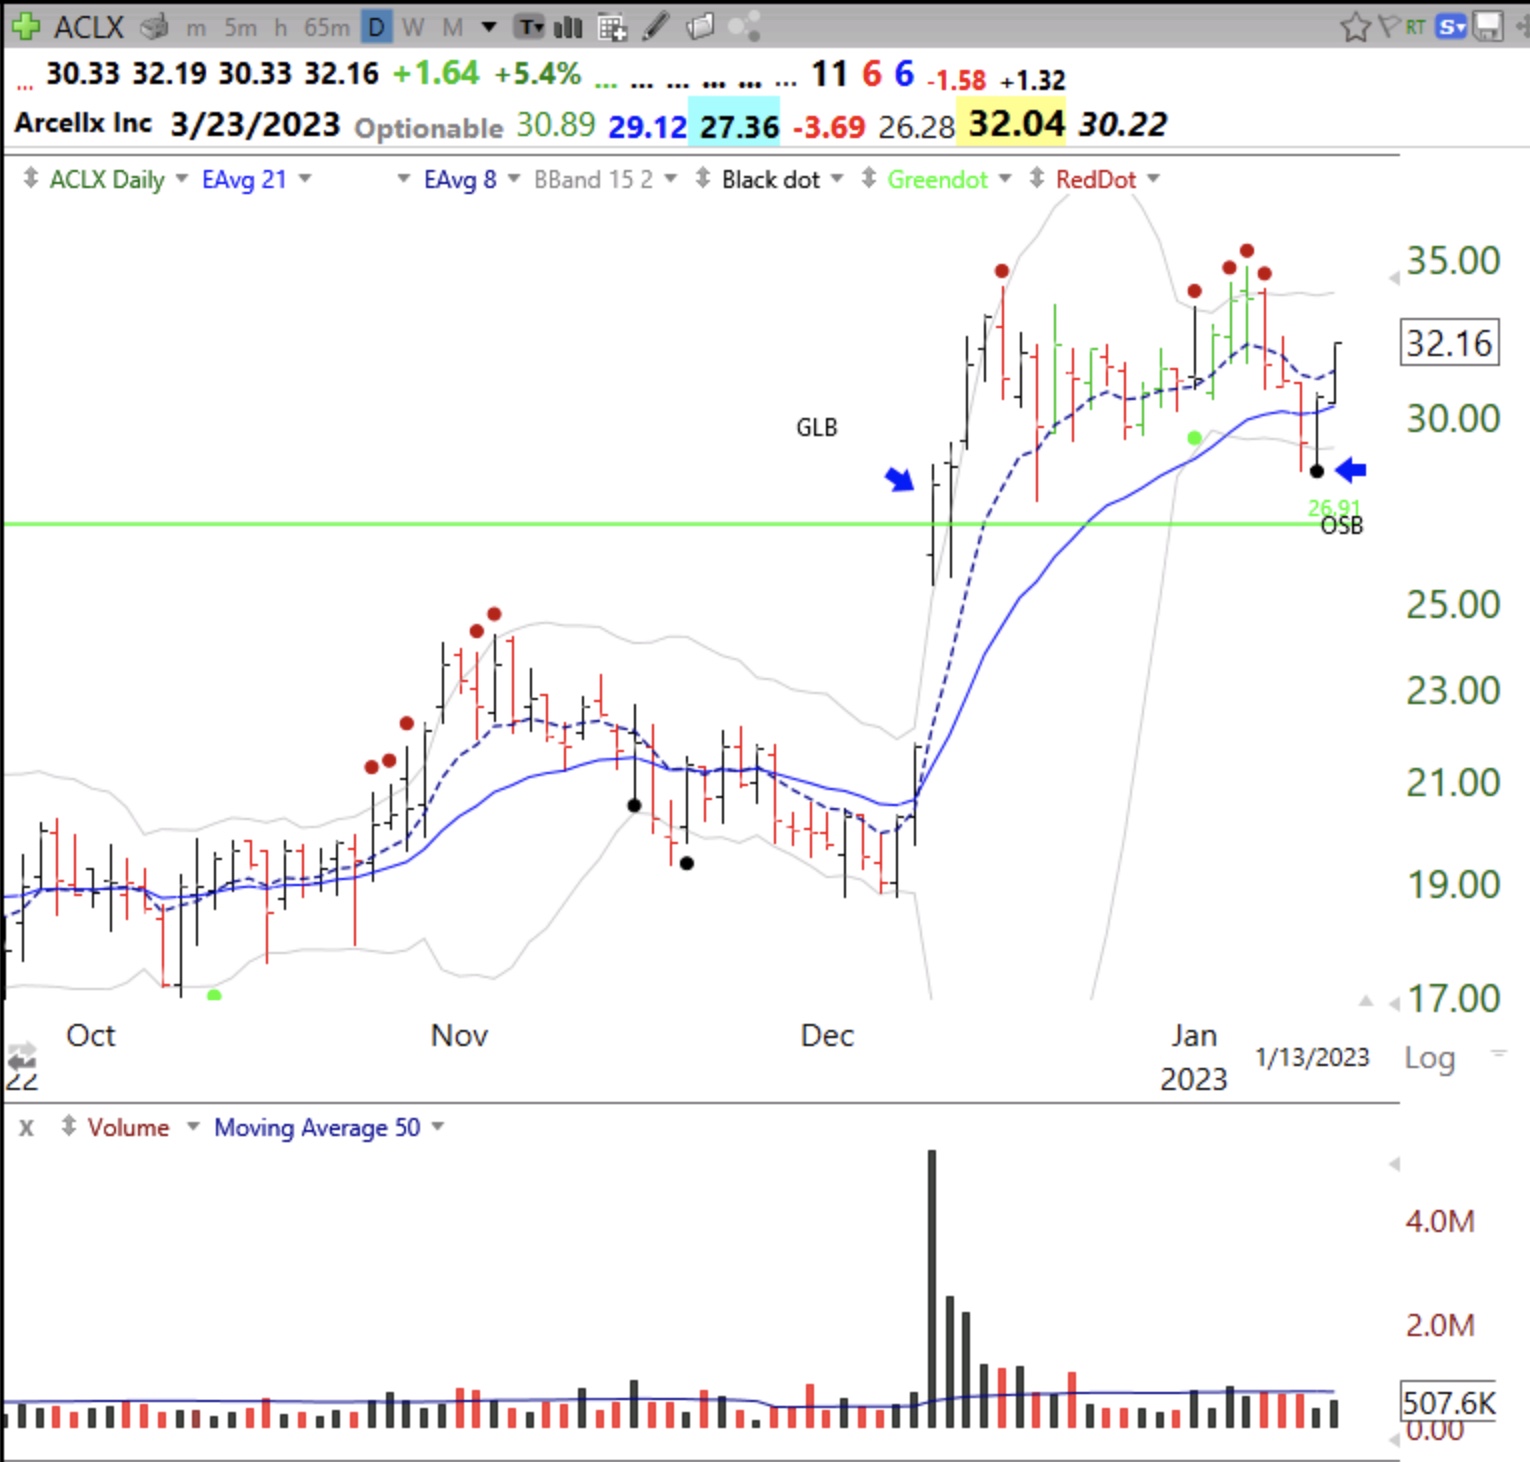
AGYS has a similar pattern. But it traded around its green line for a while.
I use TC2000 to find GLBs intraday and sometimes tweet notices @wishingwealth…..
The GMI is now 4 (of 6). The indexes are back above their 10 week averages. Stay tuned…..