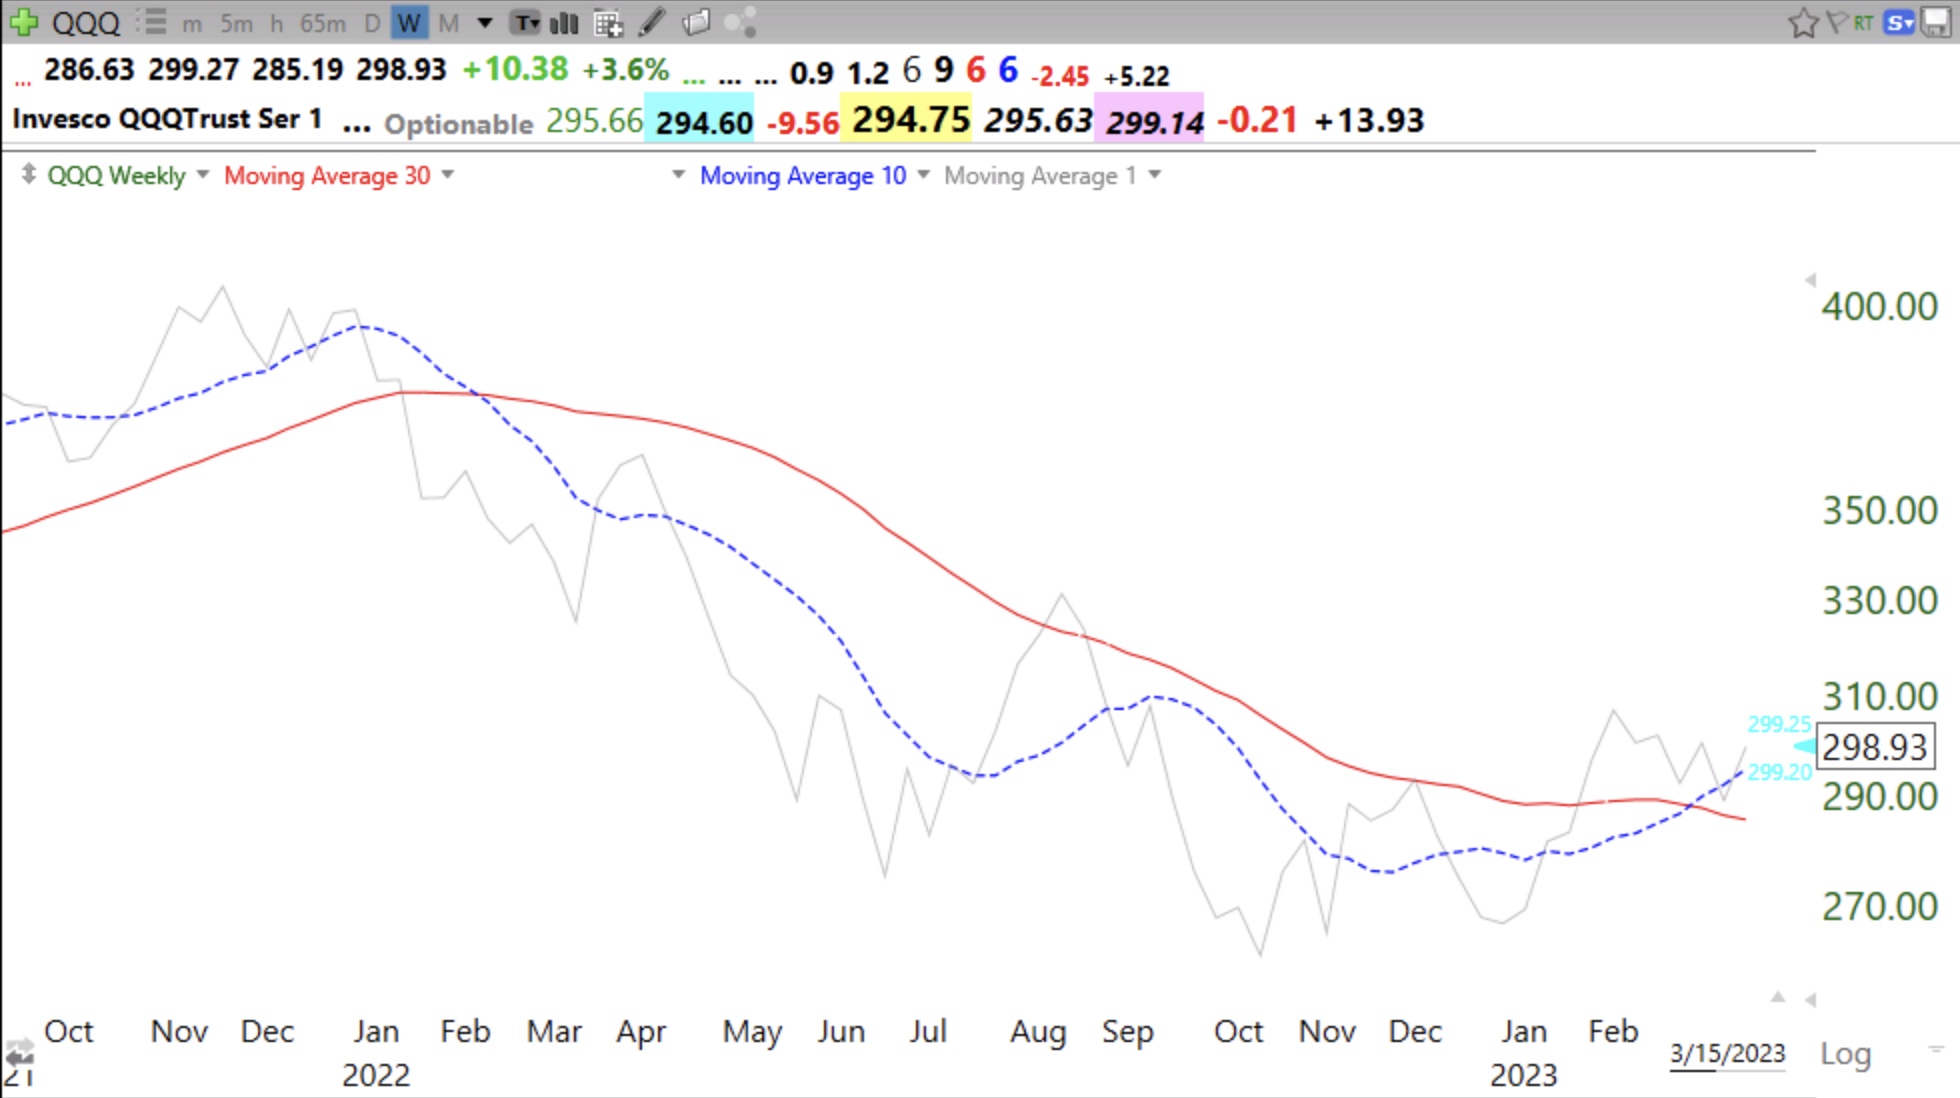
My GMI2, a set of very sensitive indicators focusing mainly on QQQ, has jumped from 1 to 6. QQQ has regained its 10 week average and the 10 week is above the 30 week (see 10/30 weekly chart below). AAPL and MSFT are showing strength. The bottom for QQQ and tech stocks could be in. I will be comfortable buying some TQQQ if/when my QQQ short term trend indicator should turn up. That could happen by Friday if we have two more days of advances. Note that QQQ does not contain financial companies and is therefore less sensitive to the current volatility in bank stocks. I will be most confident of a new major up-trend if the 30 week average should start to rise.