GMI remains at 1 and has been flashing a sell signal below 4 since the close on July 25. There were only 8 new highs and 189 new lows in my universe of 4000 stocks on Tuesday. This is not the time to buy growth stocks hoping that they will surge to new highs. This is the worst reading I have seen since June 14, 2006. I rarely see fewer than 10 new 52 week highs in a day. The Worden T2108 indicator showed just 11% of NYSE stocks above their 40 day averages. This is definitely bottoming area. The worst declines have gotten down around 6-7%. Extreme readings at major bottoms occurred in 1987, at <1% in 1990 at 5%, 1994 at 7.7%, 1998 8.5%, 2001 at 6.8%. It may be worth nibbling at index ETF’s if this indicator falls to 7%. But I try not to anticipate the market and prefer to wait for the right sign of a turn. This market looks very perilous right now.
 Dr. Wish
GMI: 1; Hysteria Reigns; Serenely in cash
When I listen to the media pundits, I think the sky is falling. But when I look at my charts, I see only a puny decline, thus far. Could it be that the self-serving speculators and powers-that-be are hyping the market decline so that the government will bail them out?
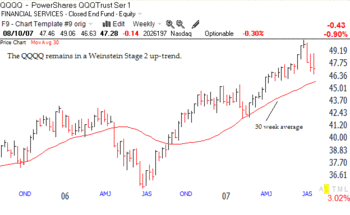
The market is actually in relatively fine shape at the moment.  The QQQQ and DIA remain above their rising 30 week averages. Compare the current decline in the QQQQ with what happened last summer. The pundits weren’t screaming bloody murder in 2006! Yes, the IJR and SPY are now below their 30 week averages, but those averages are still rising and both indexes appear to have found support at their 50 week averages where they stopped declining last summer. As Stan Weinstein so masterfully demonstrated in his book cited to the right, real declines occur when these indexes are below their declining 30 week averages. (That pattern in the QQQQ sent me to cash in October 2000.) While the short term trend is down (GMI-S: 6%), the majority of my long term indicators for the SPY, QQQQ, IJR and DIA remain positive (GMI-L: 63%). Yes, things can always get worse. But I am content to wait to see if stocks can hold their 30 and/or 50 week averages.
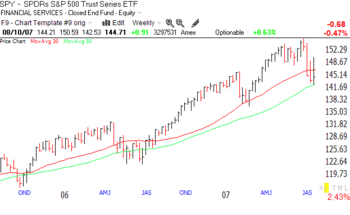
You probably are thinking that I am missing the carnage because the QQQQ omits financials.  So let’s look at the SPY, which has been weaker than the QQQQ. Can you honestly look at this weekly chart of the SPY and see an atypical decline? The SPY is sitting just below its 30 week average (red line) and above its 50 week average (green) near where it has found support in the past. Compare the current decline to that in 2006 or even 2005. I see a pattern of higher lows and rising moving averages.
So, I must conclude either that the current cries of doom are coming from persons who are much more perceptive about the true economic fundamentals than I am, or from persons who will benefit by a government bail-out, or both. Don’t get me wrong, things may get worse. But right now the market is just in an ordinary decline, and with the GMI at 1, I will remain serenely on the sidelines, mainly in cash.
GMI: 2; GMI-S: 0; Safely in cash
The GMI remains at 2 and the short term GMI-S is at 0. I am safely in cash. There is no reason to trade in this market. I will just sit back and wait for the GMI to signal an up-turn. The Worden T2108 indicator is back to 20. Thursday was the ninth day in the current QQQQ down-trend and the index is now below its 10 week average. I have the best odds of making money on the long side when the QQQQ is consistently above its 10 week average.