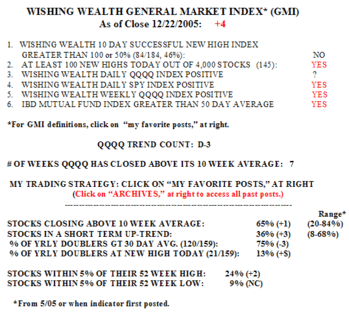
The GMI remains at +4, and the market should reveal its short term trend this week. The QQQQ closed Friday just below its 30 day average, and its declining 10 day average is just above the 30 day average (41.52/41.49). The last time the QQQQ’s 10 day average was below its 30 day was on October 31 at the beginning of the rally. Tomorrow’s close should be very important for defining the short term trend. 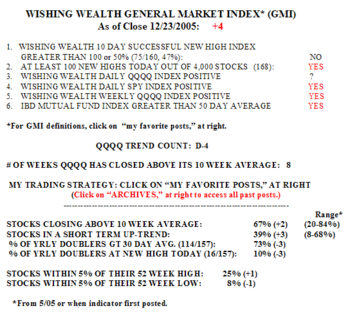 Only 47% of the 160 stocks that hit a yearly high ten days ago closed higher on Friday than ten days earlier. In addition, only 10% of stocks that have doubled in the past year hit a new high. Thus, there is some pressure on the leaders and stocks hitting new highs. On the other hand, there were 168 new highs in my universe of 4,000 stocks. But only 50-53% of the stocks in the Nasdaq 100, S&P 500 and the Dow 30 indexes advanced on Friday. The percentage of stocks in a short term up trend has risen from 33% early last week to 39%, and 67% of stocks remain above their 10 week averages. Three times as many stocks are within 5% of a new high than a new low (25%/8%). This was the eighth week that the QQQQ has closed above its 10 week average, but Friday was the fourth day in this QQQQ down trend (D-4). We therefore have a weak short term trend within a stronger long term up trend.
The WPM also shows this lesser short term strength in the QQQQ (Nasdaq 100) index. The QQQQ is the only index that closed below its 30 day 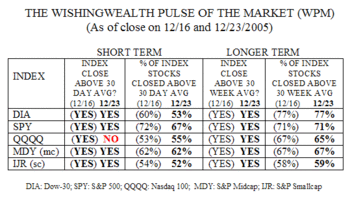 average, and only 55% of its components stocks closed above their 30 day averages. The S&P 500 stocks show the greatest short term strength, with 67% of its stocks above their 30 day averages. The S&P Small Cap Index components are also relatively week, with only 52% above their 30 day and 59% above their 30 week averages…..
A reader wrote me that he thinks the GMI is a contrary indicator. I don’t see it. 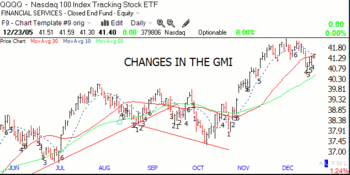 As this chart (click on to enlarge) of the changes in the GMI shows, the GMI registered a +5 or 6 during the major rallies in July and November. And when it was below 4, it was generally a declining market……………..
I hesitate to list any stocks that I find promising when the QQQQ is weak, but my scan did find some stocks to watch in the new year, if the market up trend resumes:
INGR,TIE,HSVLY,GOOG,LMS,CRM,GMXR,
AAPL,LDSH,AIRM,UBB, ARD, MDR, DBRN,GHL.
All of these stocks (I own a few) are near their all-time highs and have recent quarterly earnings increases of 100%+. With the exception of CRM, their PE’s are all less than 100. They all gained in price at least 80% in the past year. Nicolas Darvas (see links below and to the right) used to concentrate on leading stocks at all-time highs that have already doubled. To find a stock that will double, I find it best to find one that has already doubled. Of course, when buying such high momentum stocks, I must immediately limit risk by placing a stop loss order……………..
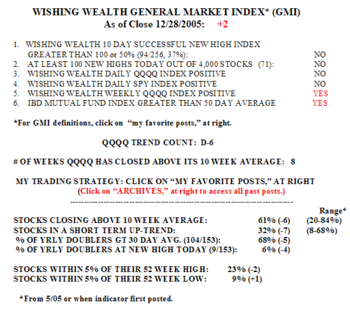 Only 6% of the stocks that have doubled in the past year hit a new high on Wednesday, further evidence that the leaders are weak. The longer term up trend is still intact with 61% of stocks above their 10 week averages and 23% within 5% of a new high. However, when the indexes close below their 30 day averages, I tend to get in cash or go short.
 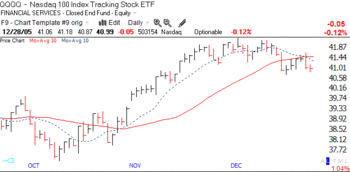 Another sign of a weak market is that the QQQQ’s 10 day average (dotted line) is now below the 30 day average (red line) for the first time since this up trend began. While this may only be a sign of short term weakness, this is how all major declines begin. About 70-80% of stocks follow the trend of the averages–and with this pattern–I am bucking the odds if I go long………..


