The QQQ bounced up from oversold last week and is closing the gap down that occurred on May 23rd. I am watching closely to see if it can break above 58.05 and remain there. If the QQQ can’t and bounces down off of that area, I expect a continuation and perhaps, a deepening of this short term down-trend. 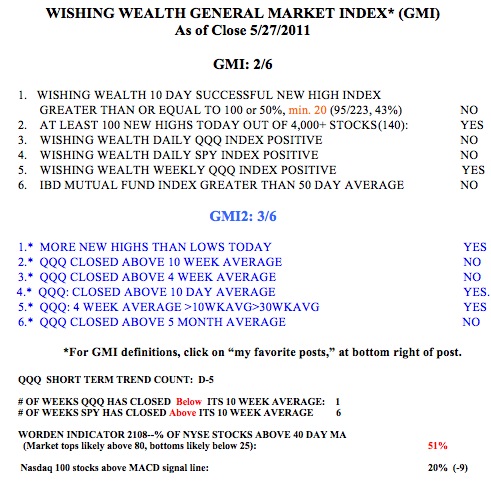 Friday marked the 5th day of the short term down-trend, and once a trend lasts this long, it usually continues for a bit. The QQQ has now closed below its important 10 week average, while the SPY bearly (pun intended) remains above its 10 week average. Both indexes are bouncing off of oversold levels, so the rise could last a few days. With the GMI at 2, I remain mostly in cash with a few hedged long positions. IBD continues to call the market in a correction and remains cautious about making new buys. Since the QQQ peaked on April 27, the Nasdaq 100 index has declined 3% and 64% of its component stocks have declined; only 16% are up 5% or more. During the same time period, 58% of the S&P500 component stocks have declined; 13% are up 5% or more. Why fight these odds by going long stocks?
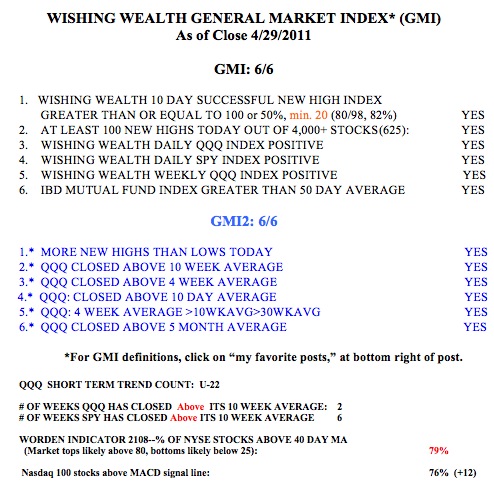
General Market Index (GMI) table
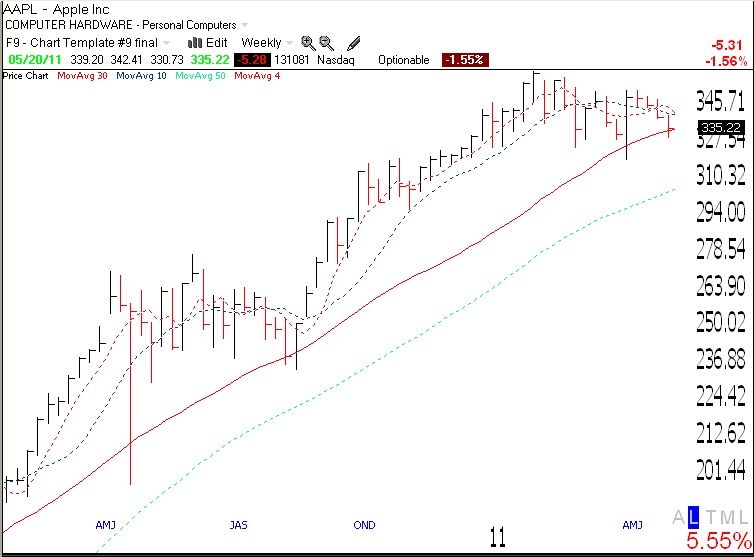
The markets look treacherous and AAPL is at a critical point.
We are in one of those periods when the market refuses to send me clear signals regarding the short term trend. I am therefore mainly in cash and/or completely hedged in my trading account. I am buying put options as insurance on all long positions. 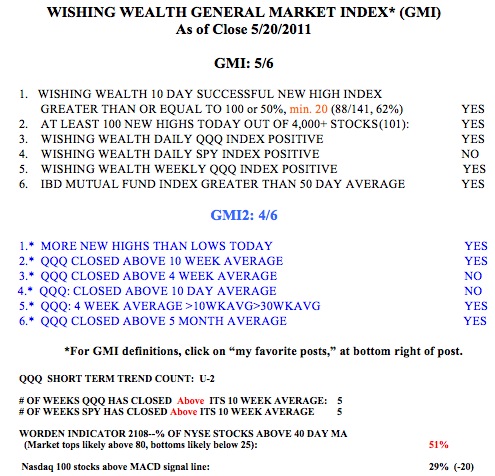 The GMI is at 5 (of 6) and the GMI2 is at 4 (of 6). Friday was the second day of the new QQQ short term up-trend. However, the QQQ could start another short term down-trend with a decline on Monday. Only 29% of the Nasdaq 100 stocks closed with their MACD above its signal line, reflecting short term weakness. The Worden T2108 is at 51%, in neutral territory.
Check out the weekly chart of the QQQ below. The QQQ has an RWB pattern and remains in a strong longer term up-trend. Nevertheless, we could experience short term weakness for a while. IBD continues to label the current market as being in a correction. 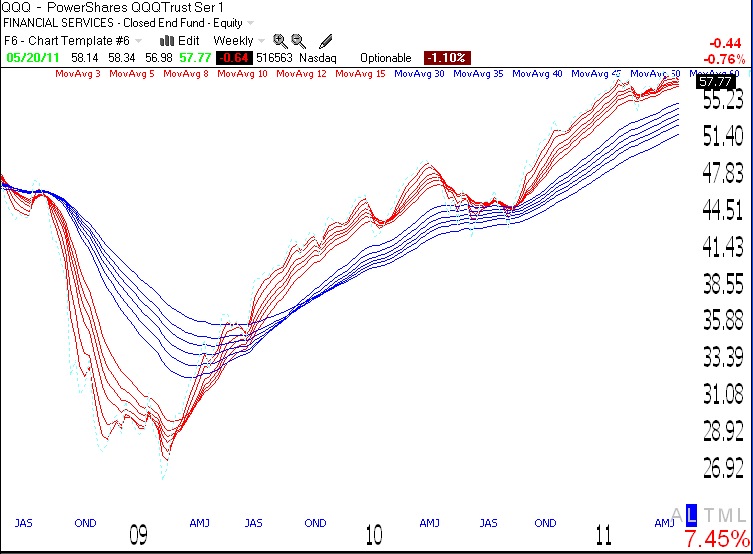
Meanwhile, AAPL is sitting on key support. A close below the 30 week average (red line) would be an ominous sign for it as well as the rest of the market. When AAPL cannot hold up, how can the market? Click on chart to enlarge.
22nd day of QQQ short term up-trend; T2108: 79%
All indicators remain positive. However, now that T2108 is at 79%, near extreme territory where past peaks have occurred. T2108 can get as high as the low 90’s however.