QQQQ trend remains flat; mainly in cash; beware September

GMI1/6
GMI-R2/10
T210848%

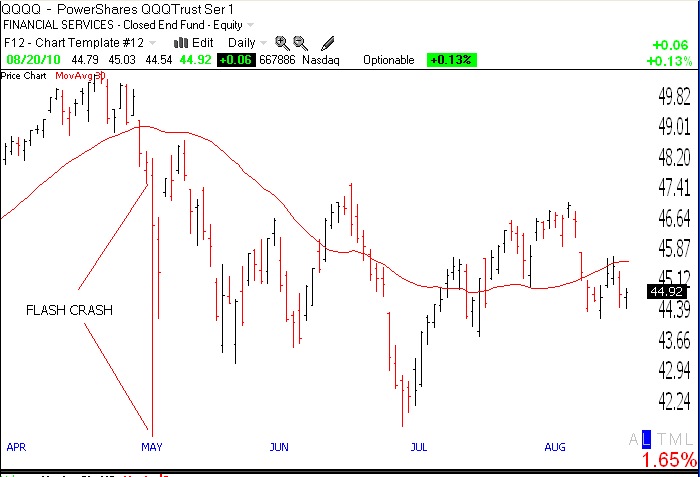
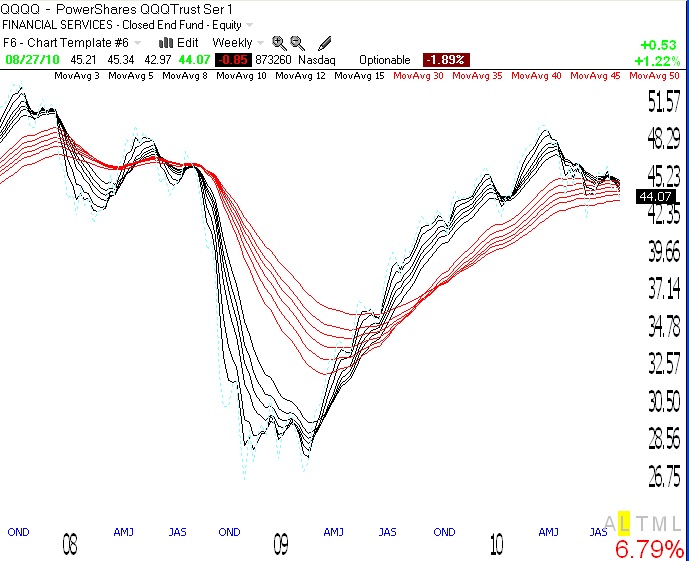
The QQQQ bounced on Friday from very oversold daily stochastic readings.   The daily stochastic remains oversold, so Friday’s bounce may last a little longer.   However this weekly GMMA chart of the QQQQ   (click on to enlarge) shows all of the moving averages converging and flat.   We are just going to have to wait for the market to break out one way or the other.

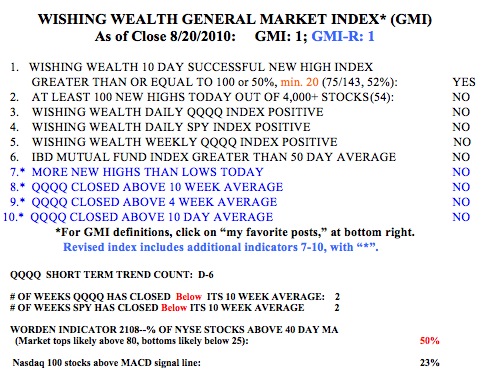
Meanwhile the GMI is one (of 6) and the more sensitive GMI-R is 2 (of 10).   The Worden T2108 is at 48%, in neutral territory.   
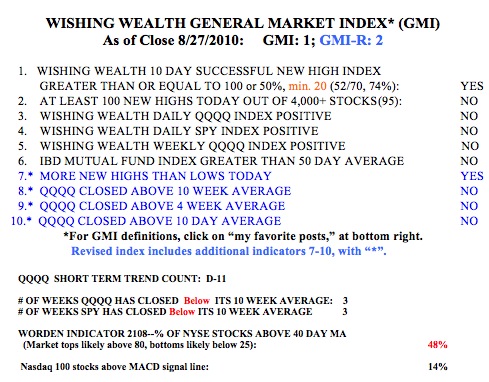
Only 14% of the Nasdaq 100 stocks closed Friday with their MACD above its signal line, an indication of general short term weakness. Friday was the 11th day (D-11) of the current QQQQ short term down-trend. And the QQQQ and SPY have closed below their 10 week averages for three straight weeks.

So, I remain largely in cash but holding a few shorts and a few long positions protected by put options. I know I shouldn’t own any stocks right now but there are a few stocks I cannot resist buying given that they have held up so well through the current market weakness.   I list   some of the stocks I am trading to the right in the “Stocks I’m Watching” section. Remember, September tends to be the weakest month of the year for the stock market.

My next Worden webinar: Tuesday 8/24; Mainly in cash

GMI1/6
GMI-R1/10
T210850%

I am inviting all of you to attend my second Worden webinar with the talented Julia Ormond   Tuesday evening.   To register for the free webinar, go to www.worden.com.   If you miss it or missed my first webinar, the Worden staff archive them on their site for later viewing.   I will talk about the current market trend and the Submarine Scan I use to identify potential shorts.

This market has continued to frustrate me.   The longer term averages remain flat and the short term averages remain in a down-trend. Since May 6,   the day of the flash crash, the range of the market has been cycling between that day’s high and low (41.55 to 48.32).   The only exceptions were   three days that occurred the week after the flash crash when the QQQQ traded slightly above this range. So, we have been in a roller coaster market as this daily chart of the QQQQ shows (click on to enlarge). My suspicion is that a new trend may assert itself when the QQQQ breaks out of this range.   Until then, the odds of making money are probably low for me, as a swing trader.   This type of volatility is probably more easily traded by day traders.

So, with the GMI and GMI-R both registering one, I must remain mainly in cash.   One of the most difficult lessons to learn is to stay out of the market when the conditions are not optimal.   When the GMI is 4 or above and the QQQQ is above its rising 10 week average, my methods tend to give me a good chance of trading profitably.   But the QQQQ, SPY and DIA have now closed below their 10 week averages for the past two weeks.   The Worden T2108 indicator is at 50%, in neutral territory. Only 23% of the NASDAQ 100 stocks closed with their MACD above its signal line, a sign of short term weakness. When only 54 stocks out of more than 4,000 in my stock universe can hit a new high ( on Friday) then my strategy of buying stocks at all-time highs is a low probability bet.   The QQQQ has now completed the 6th day of its current short term down-trend (D-6).   The last up-trend lasted 15 days,   the   preceding down-trend lasted 4 days, and the preceding up-trend lasted just 3 days. I can’t ride a stock for long in a market with such short swings.   I can trade profitably during the more typical   30-80 day trends.   So, I remain mostly in cash with a few put options on stocks that came up in my Submarine Scan, and a small position in the 3X tech bearish ETF, TYP. I am prone to betting on market weakness during the September/October period, as long as my indicators remain bearish.

Raising cash; some submarine stocks; Indexes’ daily stochastics oversold

GMI1/6
GMI-R1/10
T210853%

With the GMI and GMI-R now at one, the technical signs are just too weak to own stocks.   The QQQQ has just started a new short term down-trend (D-1) by my criteria. The 30 week average of the QQQQ is flat, which leads to many whipsaws of the indexes above and below the shorter term moving averages.   For example, the last short term down-trend lasted just 4 days, then we had a brief 15 day up-trend, which just ended.   The SPY and QQQQ are now below their 10 week averages.   My long trades are most likely to be profitable when these indexes remain above their 10 week averages.   Only 27% of the Nasdaq 100 stocks now have their MACD above its signal line, a sign of short term weakness.   Finally, the Worden T2108 indicator is at 53%, in neutral territory.   So, we are in a declining market, but not yet in an oversold state.   Most market declines end with the T2108 below 20%.   And soon we enter the typically weakest month of the year for the market–September.

In a market like this there are many submarines–stock in likely longer term down-trends.   Some of them picked up by my submarine scan are: BBBB, SNX, RTN, WDC, JCG, MR, VPRT, MD, TEVA, ASIS, LIFE, MHS, SLAB, ATHR. During market down-trends, I sometimes buy deep in the money puts on submarine stocks in my IRA. There is one caveat keeping me from   entering new   short positions right now.   The daily stochastics for the DIA, SPY and QQQQ are in oversold territory–we may get a bounce during the coming week of options expiration.