At the BEGINNING of a big market decline? My next Worden webinar

GMI0/6
GMI-R0/10
T210825%

At lunch on Friday I told my friend that I was moving 60% of my pension holdings from stock mutual funds to money market funds.   She was incredulous that I would do so after the market was already down so much.   I think her statement represents the psychology of the moment. The market has already declined, so it must be too late to get out–we have to be close to the bottom.   Maybe we are.   But my approach to the market is to look at the price and volume patterns and to ignore my emotions and beliefs about what I might want it to do.   So, when I ran one of my my TC2007 PCF ‘s (personal criteria formula)   on all ETF’s, I was struck by what I saw.   First of all, let me tell you that I ran this PCF several years ago and came up with a company that I knew little about.   The topping pattern looked so compelling that I actually bought a put option on the stock, betting that it would decline. I did not hold the put long   because I was not as convinced then of my methods.   You may have heard of the stock, Enron. My PCF detected trouble in the stock’s pattern long before anything came out in the press and before the stock began a long decline to zero.

Anyway, I ran the same PCF on the list of ETF’s in TC2007 and found 91 hits out of 951.   The PCF I ran detects a pattern where the long term average is just beginning to reverse down.   Thus, a lot of other ETF’s that are already in established down-trends would not come up.   I was struck by the ETF’s that did come up because they represented entire country markets in some cases.   For example, India (BKF, INP), Latin America (ILF), Asia Pacific (GMF), China (GXC), Brazil (EWZ), Emerging Europe (GUR).   Add to the list a few of the U.S. indexes that came up such as:   S&P500 (IVV), Dow 30 (IYJ), Russel 1000 Growth (IWF).   Russell 3000 Value (IWW).   Now add to the list a whole set of industries: Financials (IYG), Metals and mining (XME), Software (IGV), Oil (IEZ), Healthcare (IYH). These are just a few of the indexes and industries whose ETF showed up in my scan.

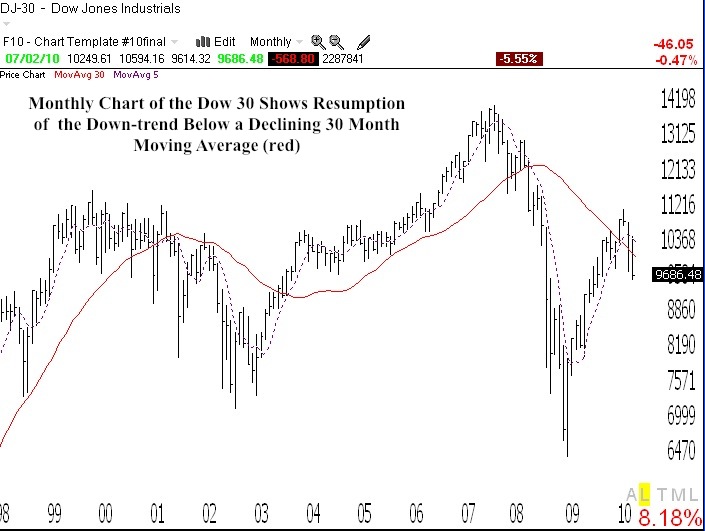
No one knows how long these   down-trends will last.   However, I am talking about down-trends based on weekly averages, which generally are related to major trends.   For my own comfort, I would rather get out of the market and wait for these averages to reverse up again, than to gamble my critical pension money while I hope for the turn.   If the market were to turn up in the next few months I would have no regrets as I would simply hop back on at a higher level.   The weekly averages tend to represent trends that last for months, so I have plenty of time to ride a new up-trend.   In the past, during the few times I have moved my pension funds to money market funds, I have always been scared that I was making the wrong move.   But my   early exits saved me from taking huge losses in the 2000-2002 and 2008 market declines.   When I look at this monthly chart of the Dow 30 (click on to enlarge), I see an ending of the rebound from the 2008 decline and a possible resumption of the decline.   How far the Dow 30 will fall this time is unknown, but with the other ETF’s   from the rest of the world in a decline, I am staying safely on the sidelines until I see a new up-trend. See this interesting article about Robert Prechter who is predicting a massive decline–yet again!

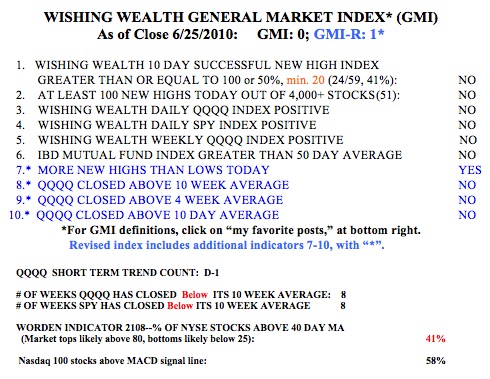
Meanwhile, the GMI and GMI-R remain at zero.   The Worden T2108 Indicator is at 25%, still out of oversold territory where markets tend to bottom.   
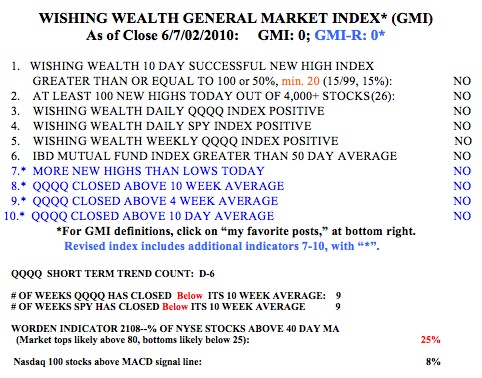
The QQQQ short term down-trend has now continued for six days. The QQQQ and SPY have closed below their critical 10 week averages for 9 weeks.   And now, only 8% of the NASDAQ 100 stocks have their MACD above its signal line, a sign of short term weakness. With market leaders (GOOG, NFLX, AAPL) weakening, it bodes poorly for the entire market.   When the leaders cannot hold their ground, it often portends a down market. I am mainly in cash or short and will use any short term strength to short more.

I am very concerned about the consequences to our society and to our financial well being if this market declines back to the 2008 lows or beyond. I do not generally look to the fundamentals to assess the stock market’s trends, but with federal, state and local governments apparently getting ready to sacrifice millions of workers on the altar of deficit reduction, I see little reason for an up-turn in consumer psychology and spending.

I am presenting my second Worden webinar on August 24. I plan to provide details of my submarine scan and how I find stocks to short. You can see my first webinar by going to their site (worden.com) and scrolling down to the one entitled: A word from the professor.   It will be a while before you can sign up for the August free webinar. I am pleased to support Worden with these webinars because the company has been a strong supporter of my university classes in technical analysis.   I compute virtually all of my market statistics using their incredible charting and analysis software.

You may contact me at:   silentknight@wishingwealthblog.com

I only ride the yellow band trends! Down-trend, in cash or short; Some possible submarine stocks–GOOG????

Well, the GMI is back to zero and, by my definition,   the QQQQ short term up-trend is now over.   One of the toughest lessons I have learned over the past 40 years is that I should only stay in the market when there is a well defined trend.   What used to happen to me was that I would ride an up-trend to profits only to give back all of my profits and more, as the market entered a decline.   But how to determine when there is a meaningful trend?   After studying past winning stocks, I discovered the “yellow band” pattern that works quite well for individual stocks.   I decided to apply my yellow band approach to the Guppy Multiple Moving Average daily chart of the QQQQ. (Click on chart to enlarge.) The yellow band pattern is present when I can draw a yellow band between   certain short term and longer term moving averages, that are in turn rising or falling together.   Here you can see the yellow band up and down trends that occurred in the QQQQ since late 2009.   It is during yellow band trends that I can usually make money trading consistent with the trend. At the present time, the QQQQ is not in a well defined trend, although it may be starting a new yellow band down-trend.   All of the short term moving averages (black lines) in the chart are now below the longer term averages (red lines), but they are not separated by much.   For me, the odds are presently slim for my trading   long or short positions profitably, until a new yellow band trend materializes.   Just remember, a change in trend can begin at any time.

So, the GMI is back to zero, indicating that my original short and longer term market indicators are all negative. The revised, more sensitive GMI-R is at one, because there were more new highs than lows on Friday in my universe of 4,000 stocks. Friday was the first day in the new QQQQ short term down-trend (D-1). The QQQQ and SPY have remained below their 10 week averages for 8 weeks, so even during the brief, 7 day   short term up-trend that just ended, the longer term weekly trends were weak.   The Worden T2108 Indicator is at 41%, in neutral territory.   And 58% of the NASDAQ100 stocks have their MACD above its signal line, down from 95% last Friday.

I wish I could be more positive about the market’s trend.   But when my indicators are so weak, it makes no sense for me to try to make money by going long stocks.   And yet, the QQQQ short term down-trend is only one day old.   When I get a new down-trend I sometimes buy a little   QID or TYP (ultra short ETF’s) with the idea of selling it if the trend reverses up, or adding to my position if the market decline deepens. The key to trading success is to have many small losses and a few very large gains.

I promised to provide a list of some submarine stocks, stocks that look weak to me by my technical standards.   See the last post on submarines I did when I discussed PWRD, which is down more than 30% since then.   Submarine stocks tend to decline, sometimes greatly,   as long as the market’s tide is going out.   Here are 10 of the 95 stocks that showed up, based on my TC2007 scan of the market after Friday’s close: WDC, TECD, VPRT, ALGT, ATNI, UIS, ATHR, BWLD, SLAB, and most interestingly, GOOG.   These stocks may be forming Stage 4 declines, a la Weinstein (see his book to the lower right).   This is a good watch list for me to   research on such things as sector strength, short interest and other technicals. I hold no short positions in any of these stocks.

Some Stocks Near All-Time highs; Since June 4, IBD100 Stocks 3x more likely to rise 10%+

GMI4/6
GMI-R7/10
T210850%

I often search for new market leaders by scanning stocks that hit new 52 week highs.   This table   (click on to enlarge) shows stocks that hit a new high on Friday,   that are near their all-time highs, and had most recent quarterly earnings increases of   at least +50%.   The first EPS column is the most recent quarter’s earning’s change, followed by the prior quarter’s change, followed by the annual increase in earnings. Next comes P/E ratio, Friday’s close divided by the close one year ago, % change in revenue last quarter, and the P/S (price to sales) ratio.   Of note, all of these stocks had an increase in revenues (sales) last quarter.   As is typical, the majority of these 11 stocks (64%) also have shown up in my past IBD100 or New America stock lists, as shown by the flag (check)   to the left of the symbol.   If this up-trend is for real, some of these stocks may prove to be among the leaders of the new up-trend.   Of course, the next step is to research each stock’s fundamentals and business concept before considering a purchase.

From time to time, I analyze how a recently published IBD100 stock list has performed since its Monday publication.   I examined the list published on Monday,   June 7th and looked at the change in these stocks since their close the preceding Friday (6/4).   From that time through the close on 6/18, I found that 91% of the IBD100 stocks advanced.   The median change was +6.5%, and 21%of the stocks rose 10% or more.   In contrast, during the same period, 90% of the NASDAQ 100 stocks advanced, with a smaller median change of   +4.8%, and with only 8% of the stocks rising 10% or more.   Thus while almost all of the IBD100 and NASDAQ100 stocks rose during this period, the IBD100 stocks were three times more likely to advance 10% or more. In fact, the largest gainer in the NASDAQ100 stocks was WCRX (+13%), while six IBD100 stocks rose from   15% to 24%. These data do not support the often quoted assertion that when a stock appears on the IBD100 list, it is too late to buy. On the other hand, we have shown before that during a market decline, IBD100 type growth stocks tend to fall more quickly than other stocks.

I also looked at the top ten ranked stocks on the IBD100 list published on 6/7. Eight of the ten (80%) have advanced, with the biggest rises occurring in NFLX (+15%),   WPZ (+12%) and DECK (+12%).   The two declines were in DGIT (-<1%) and MED (-4%).   So, some of the top 10 stocks did quite well!

Sometimes it is difficult to grade the components of the GMI.   This week, two of the components received a “?” because they are too close to call.   I therefore kept the total readings the same as Thursday’s, with the GMI at 4 and the GMI-R at 7.   Those of you who prefer a rigid adherence to the criteria can go with readings of   3 and 6, respectively. A strong day on Monday would probably turn the GMI to 5, because we had 99 new highs in my universe of 4,000 stocks on Friday.   Friday was the third day (U-3) of the new QQQQ short term up-trend.   Of note, is that the Worden T2108 Indicator is now at 50%, and once the pendulum moves out of oversold territory, it typically goes back to around 80%.   Also, 95% of the NASDAQ 100 stocks have their MACD above its signal line (a positive histogram), a sign of short term strength.   I would feel more confident of this new up-trend if it can reach day 5 and if the QQQQ’ could rise above its 10 week average.   So, I am holding some long positions, and will add to them if the up-trend continues.   At the beginning of a new up-trend, we often are scared to go long because we are driving along, looking through the rear view mirror at the recently ended decline…..