I often search for new market leaders by scanning stocks that hit new 52 week highs. This table (click on to enlarge) shows stocks that hit a new high on Friday, that are near their all-time highs, and had most recent quarterly earnings increases of at least +50%. The first EPS column is the most recent quarter’s earning’s change, followed by the prior quarter’s change, followed by the annual increase in earnings. Next comes P/E ratio, Friday’s close divided by the close one year ago, % change in revenue last quarter, and the P/S (price to sales) ratio. Of note, all of these stocks had an increase in revenues (sales) last quarter. As is typical, the majority of these 11 stocks (64%) also have shown up in my past IBD100 or New America stock lists, as shown by the flag (check) to the left of the symbol. If this up-trend is for real, some of these stocks may prove to be among the leaders of the new up-trend. Of course, the next step is to research each stock’s fundamentals and business concept before considering a purchase.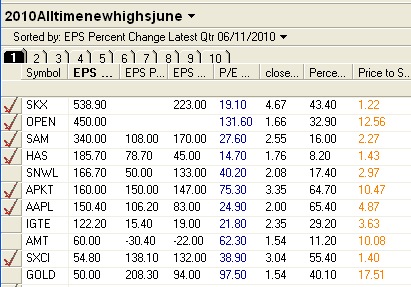
From time to time, I analyze how a recently published IBD100 stock list has performed since its Monday publication. I examined the list published on Monday, June 7th and looked at the change in these stocks since their close the preceding Friday (6/4). From that time through the close on 6/18, I found that 91% of the IBD100 stocks advanced. The median change was +6.5%, and 21%of the stocks rose 10% or more. In contrast, during the same period, 90% of the NASDAQ 100 stocks advanced, with a smaller median change of +4.8%, and with only 8% of the stocks rising 10% or more. Thus while almost all of the IBD100 and NASDAQ100 stocks rose during this period, the IBD100 stocks were three times more likely to advance 10% or more. In fact, the largest gainer in the NASDAQ100 stocks was WCRX (+13%), while six IBD100 stocks rose from 15% to 24%. These data do not support the often quoted assertion that when a stock appears on the IBD100 list, it is too late to buy. On the other hand, we have shown before that during a market decline, IBD100 type growth stocks tend to fall more quickly than other stocks.
I also looked at the top ten ranked stocks on the IBD100 list published on 6/7. Eight of the ten (80%) have advanced, with the biggest rises occurring in NFLX (+15%), WPZ (+12%) and DECK (+12%). The two declines were in DGIT (-<1%) and MED (-4%). So, some of the top 10 stocks did quite well!
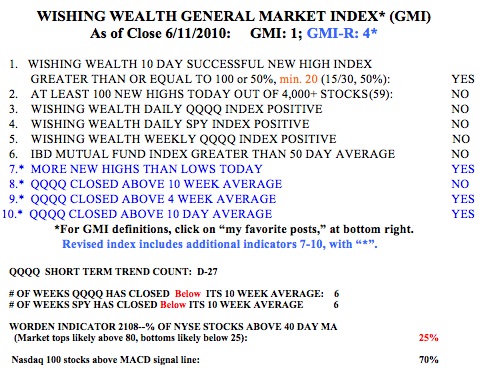
Sometimes it is difficult to grade the components of the GMI. This week, two of the components received a “?” because they are too close to call. I therefore kept the total readings the same as Thursday’s, with the GMI at 4 and the GMI-R at 7. Those of you who prefer a rigid adherence to the criteria can go with readings of 3 and 6, respectively. A strong day on Monday would probably turn the GMI to 5, because we had 99 new highs in my universe of 4,000 stocks on Friday. 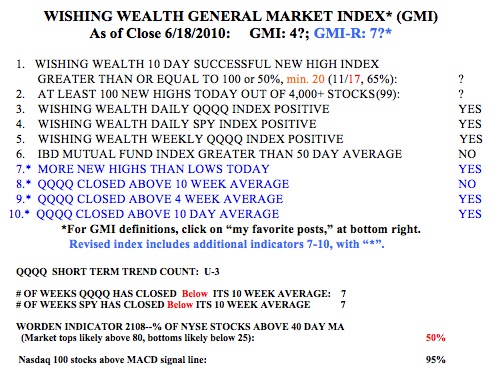 Friday was the third day (U-3) of the new QQQQ short term up-trend. Of note, is that the Worden T2108 Indicator is now at 50%, and once the pendulum moves out of oversold territory, it typically goes back to around 80%. Also, 95% of the NASDAQ 100 stocks have their MACD above its signal line (a positive histogram), a sign of short term strength. I would feel more confident of this new up-trend if it can reach day 5 and if the QQQQ’ could rise above its 10 week average. So, I am holding some long positions, and will add to them if the up-trend continues. At the beginning of a new up-trend, we often are scared to go long because we are driving along, looking through the rear view mirror at the recently ended decline…..