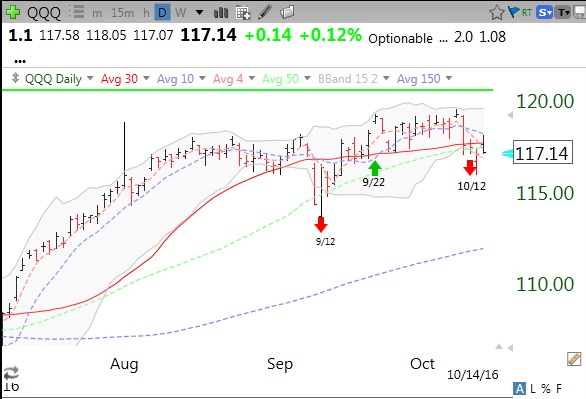
The DIA, SPY and QQQ index ETFs are all above their 10 week averages again! Stocks are breaking out everywhere. But how to ride them to big proftis? If you are like me, you often hop on a growth stock, only to sell out prematurely on weakness that you spotted on a daily chart, and the stock continues to climb much higher without you. The great gurus I follow say that the key to making big money trading is that when the rare pick starts to really work out, stay with it until it shows genuine signs of weakening. Jesse Livermore, the consummate trader, would often say that he hated to lose his position in a rising stock because he had sold out too quickly. In this new day of instant financial data feeds, I suspect one of the enemies of staying with a good stock (at least for swing traders) is focusing on charts with daily and shorter time periods to signal an exit. I am told that the great William ONeil, founder of IBD, used only weekly charts because they more clearly revealed to him the meaningful stock trends. If I checked my blood pressure or cholesterol daily or hourly, I suspect I might see a lot of noise and volatility that would make it harder to obtain a valid assessment of my longer term status.
As a solution to this problem, I have found it very helpful to focus on weekly charts using three simple moving averages: 4wk, 10wk and 30wk. An advancing growth stock will have a pattern of the 4wk>10wk>30wk for long periods of time, in addition to being near an all-time high. During a strong advance the stock will go many weeks without ever closing below its 4wk average. Once the stock closes below its 4wk it is a potential sign of weakening at which point I might raise my stops or sell a little. A weekly close below the 10week is a call for me to exit my position immediately. Growth stocks should not close the week below their 10 week average.
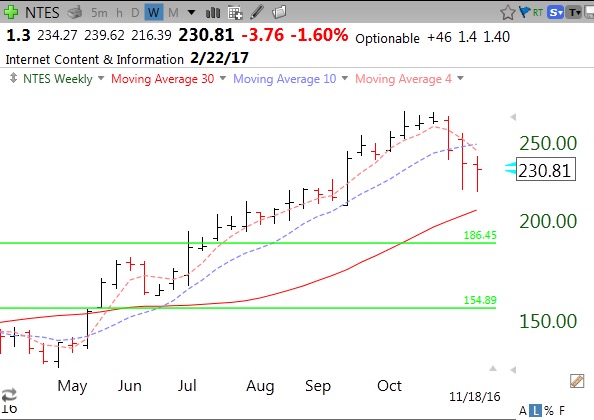
A weekly chart is worth a 1,000 words, so it will be easier to demonstrate this strategy with an example. NTES showed the 4>10>30 pattern from June, 2016 through November, or for about 21 weeks (4wk=red dotted line, 10wk=blue dotted, 3o wk=red solid). During that time the stock rose over 40%. During this period, NTES closed the week below its 4wk average only 3 times. I say closed the week because a stock often trades intraweek below its 4wk average only to find support and close the week back above it. This strategy therefore works well for part-time traders like me who are able to review their stocks over the weekend or near Friday’s close. I am looking for weekly closes below the 4wk after several weeks of closing above it and for any close below the 10 wk average. In early November, NTES closed below its 4wk and then its 10week, a clear signal for me to exit (if I had owned it). Note that NTES is still in a Stage 2 advance, above its rising 30 week average, and I would consider purchasing it with a weekly close back above the 10 week average.
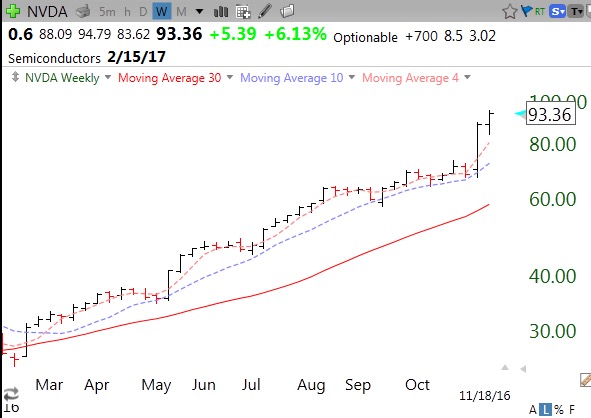
Note how this strategy would have kept one in NVDA: (I wish I had used it!)
I often tell my students not to take what I teach them on faith, but to test everything for themselves. Go out and look at the weekly charts of stocks you are trading and see if this method could have helped you. I have too many times been prematurely shaken out of a stock by focusing on its daily movements, only to see that a glance at its weekly chart could have given me the confidence to ride it higher. This method slows down my selling. I described this strategy in greater detail in a 2012 speech to the Houston Worden TC2000 Users group. A link to the archived webinar appears here and to the right of this page.
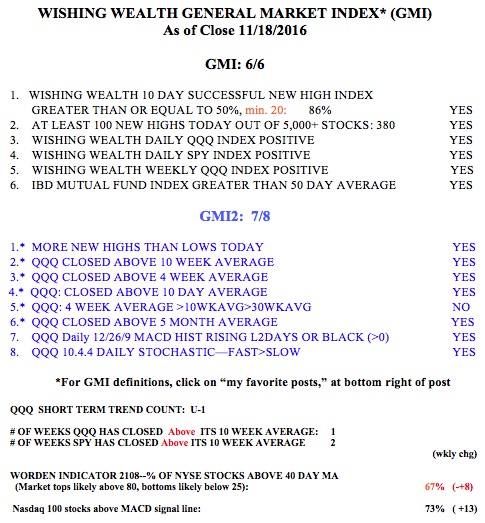
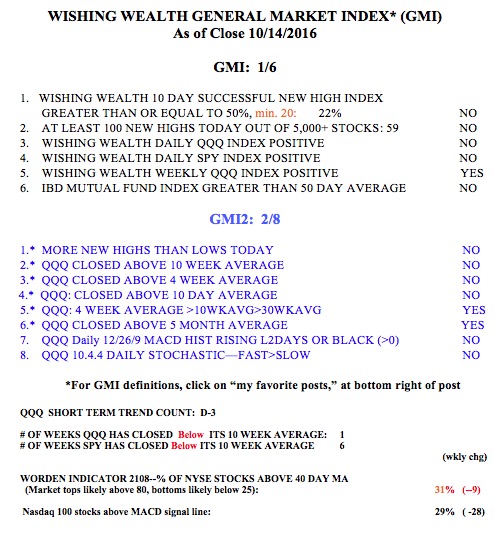
Meanwhile the GMI is back to 6 (of 6) and the QQQ short term trend is now up (U-1).