So many failed break-outs, $QQQ-head and shoulders top? Tuesday, March 5, 2019 @ 8:37 am by Dr. Wish GMI6/6 GMI-25/9 T210874% With so many failed break-outs could the QQQ be setting up for a head and shoulders top? Check out this weekly chart. Share this: Click to email a link to a friend (Opens in new window) Email Click to share on Facebook (Opens in new window) Facebook Click to share on X (Opens in new window) X Click to share on LinkedIn (Opens in new window) LinkedIn Click to print (Opens in new window) Print More Click to share on Pocket (Opens in new window) Pocket Click to share on Pinterest (Opens in new window) Pinterest Click to share on Tumblr (Opens in new window) Tumblr Click to share on Reddit (Opens in new window) Reddit Click to share on Telegram (Opens in new window) Telegram Click to share on WhatsApp (Opens in new window) WhatsApp Related
I took a closer look at your above weekly QQQ chart – and the 30 week MA still appears to point downward. Is this what you are seeing as well? Oddly though, when I chart this same graph on Yahoo Finance Chart – the 30 week MA looks like it’s slowly heading upwards. thoughts? Loading...
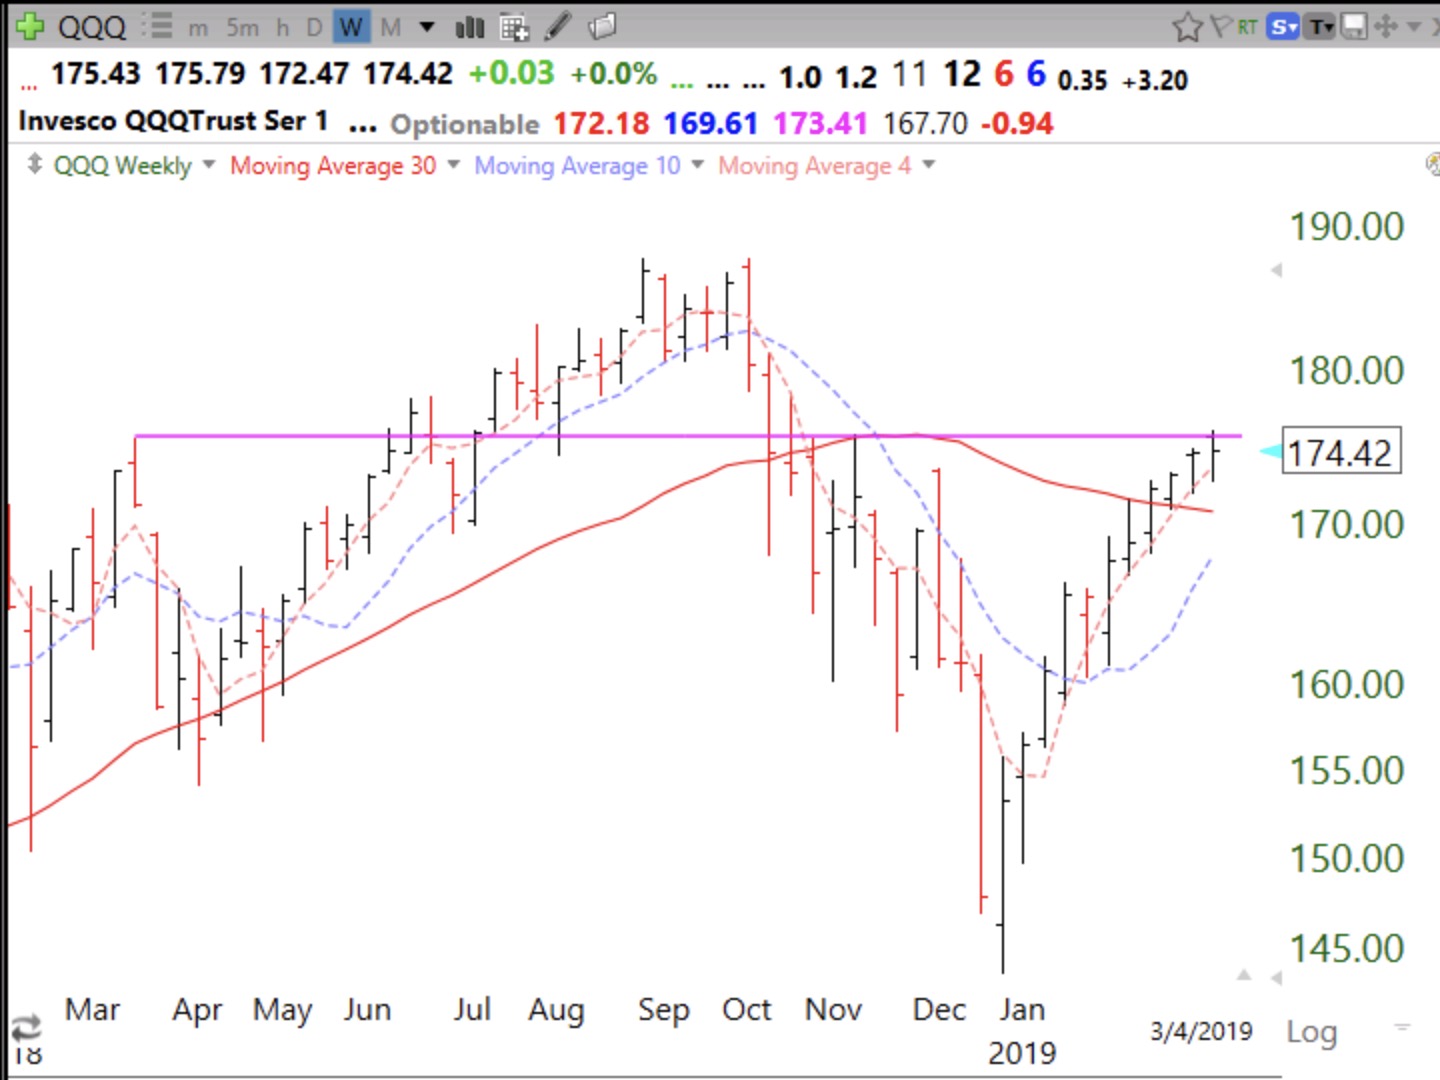
I took a closer look at your above weekly QQQ chart – and the 30 week MA still appears to point downward. Is this what you are seeing as well?
Oddly though, when I chart this same graph on Yahoo Finance Chart – the 30 week MA looks like it’s slowly heading upwards.
thoughts?
Failed BOs?