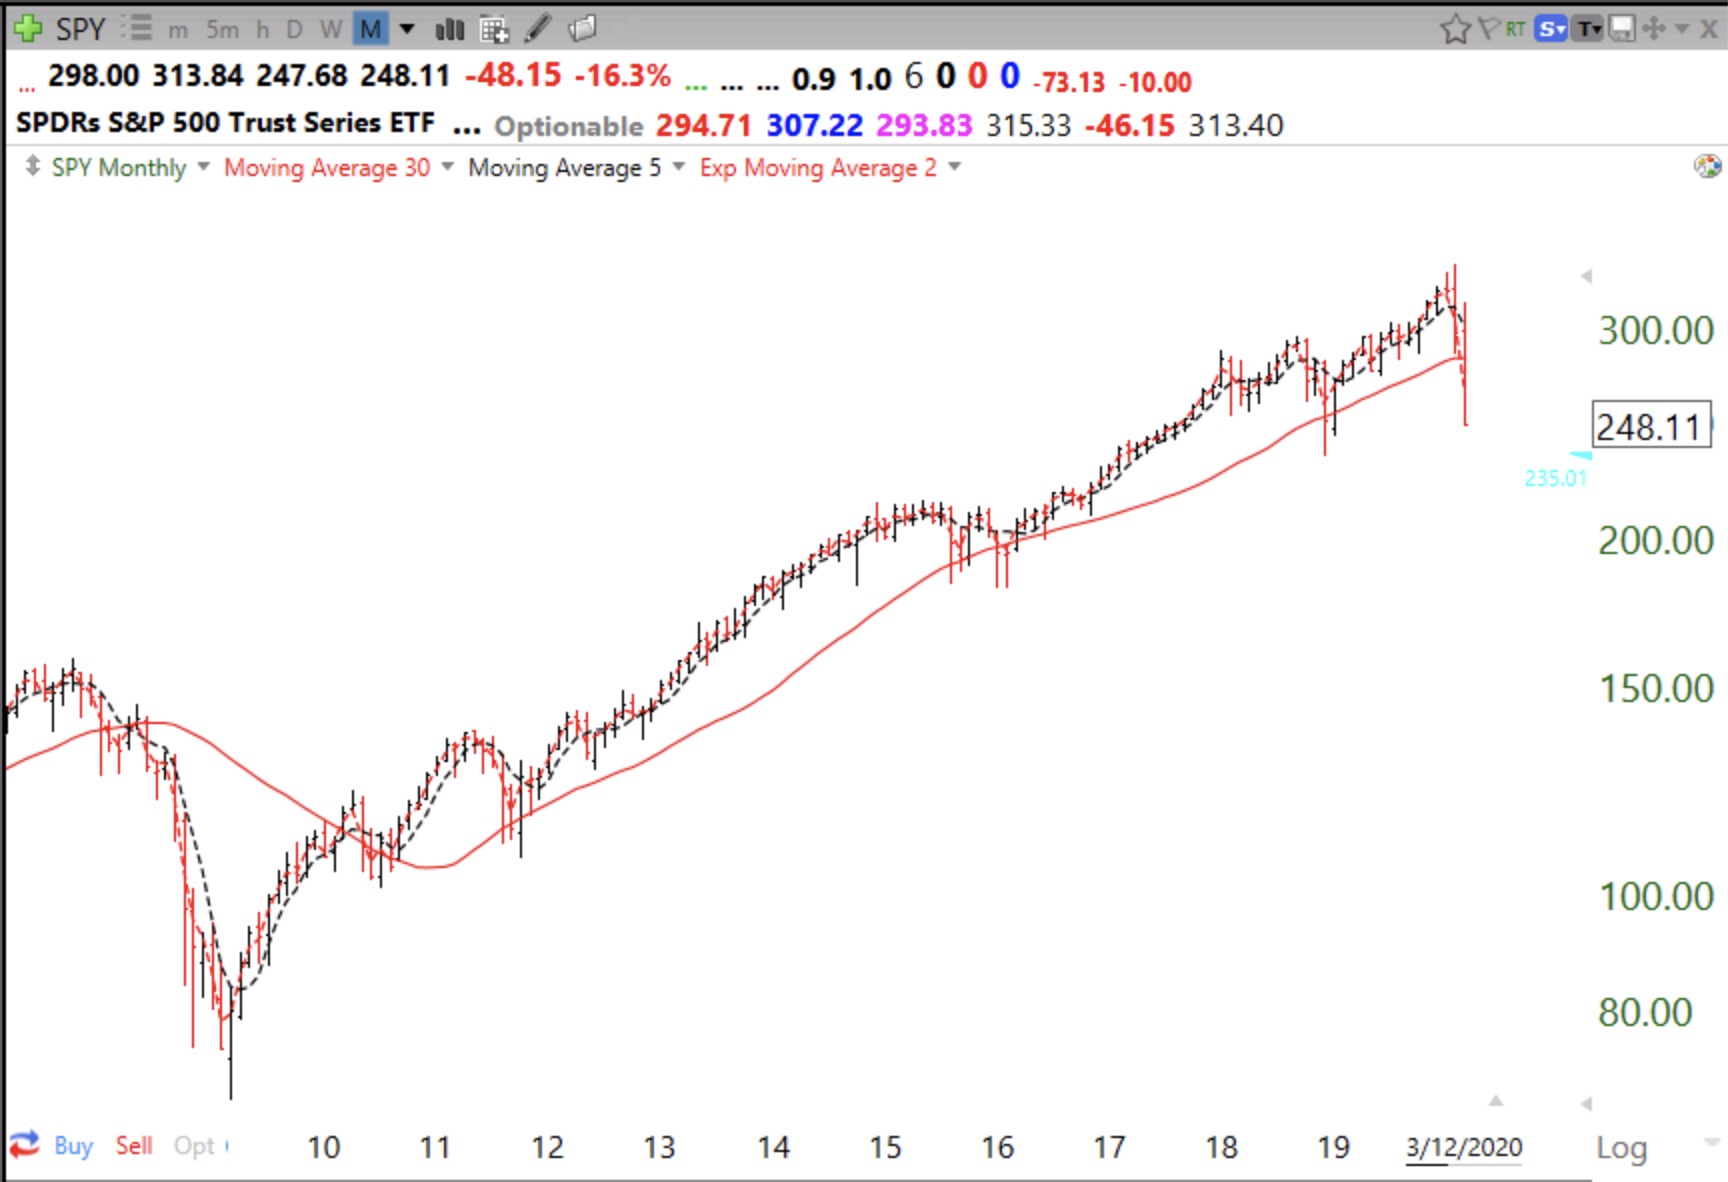
Monthly chart shows market could fall much more; 13th day of $QQQ short term down-trend Friday, March 13, 2020 @ 12:02 am by Dr. Wish GMI0/6 GMI-21/9 T21082% This monthly chart of the SPY shows that the decline thus far is quite small compared with the one in 2008. This market could fall much more. Share this: Click to email a link to a friend (Opens in new window) Email Click to share on Facebook (Opens in new window) Facebook Click to share on X (Opens in new window) X Click to share on LinkedIn (Opens in new window) LinkedIn Click to print (Opens in new window) Print More Click to share on Pocket (Opens in new window) Pocket Click to share on Pinterest (Opens in new window) Pinterest Click to share on Tumblr (Opens in new window) Tumblr Click to share on Reddit (Opens in new window) Reddit Click to share on Telegram (Opens in new window) Telegram Click to share on WhatsApp (Opens in new window) WhatsApp Related