Solar is above the clouds; $TAN Solar ETF has almost tripled the past year and is now at ATH Wednesday, November 25, 2020Wednesday, November 25, 2020 @ 9:02 am by Dr. Wish GMI6/6 GMI-27/9 T210880% 
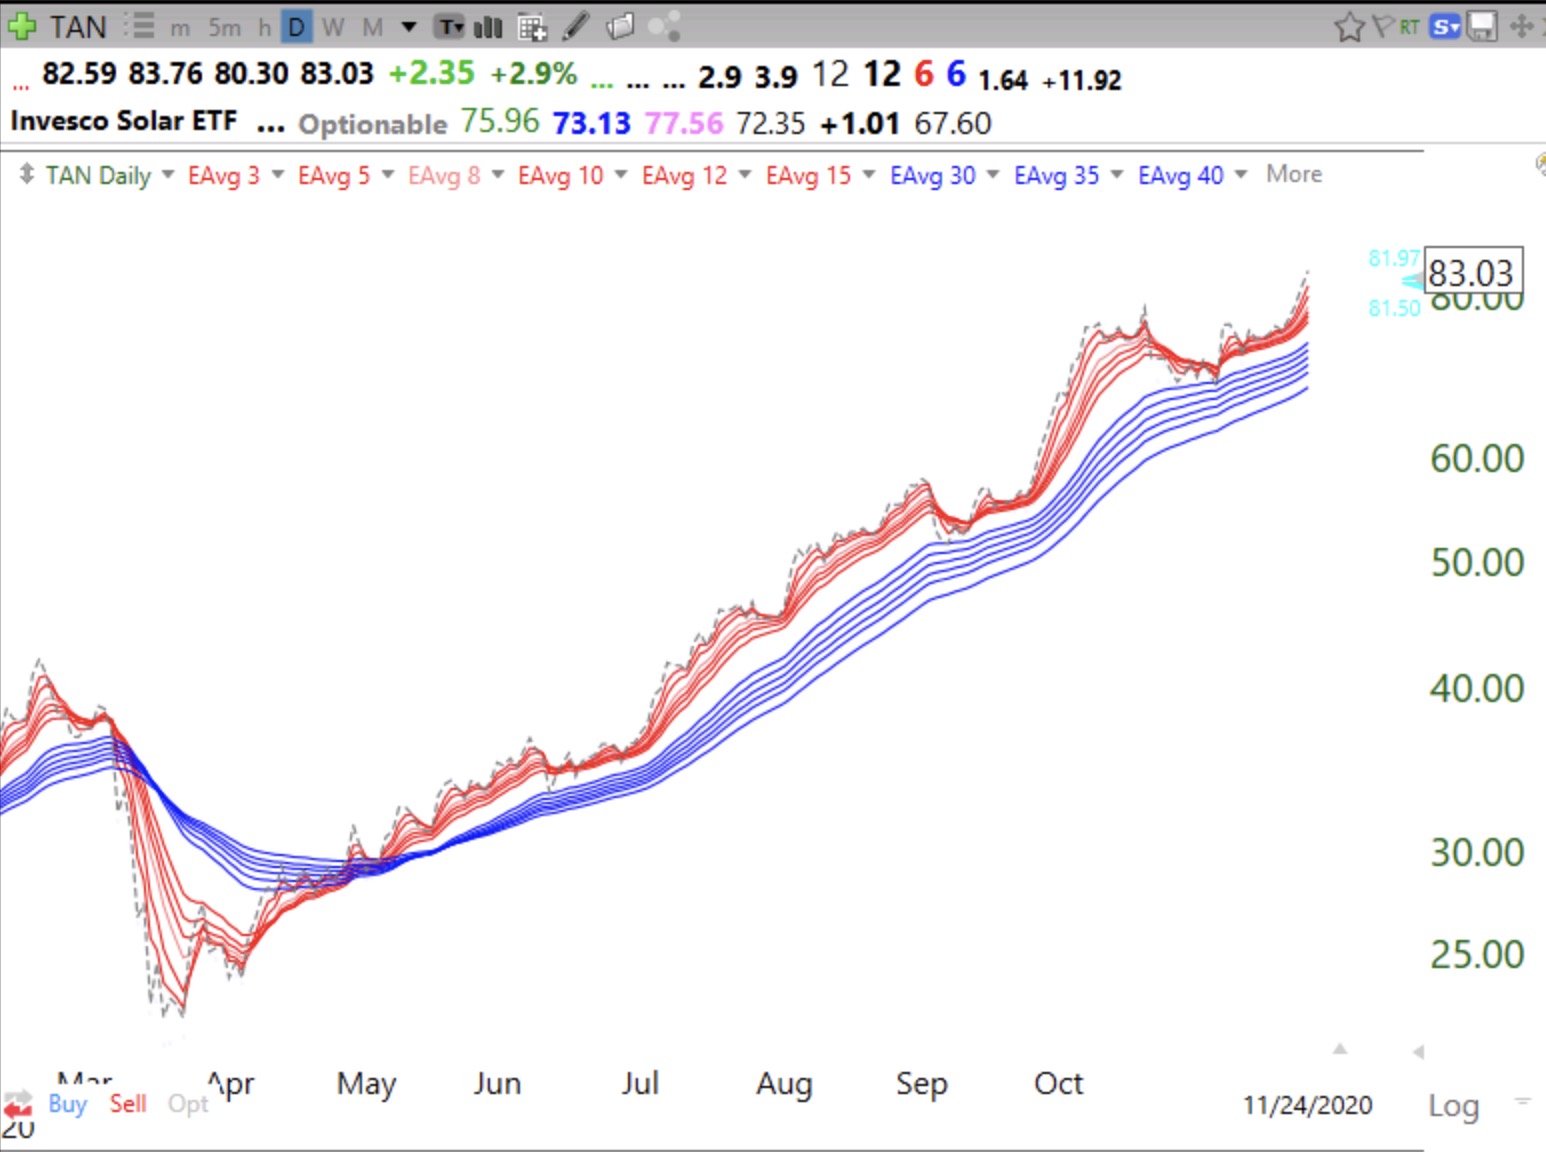
GMMA daily chart, RWB the entire time since May. 
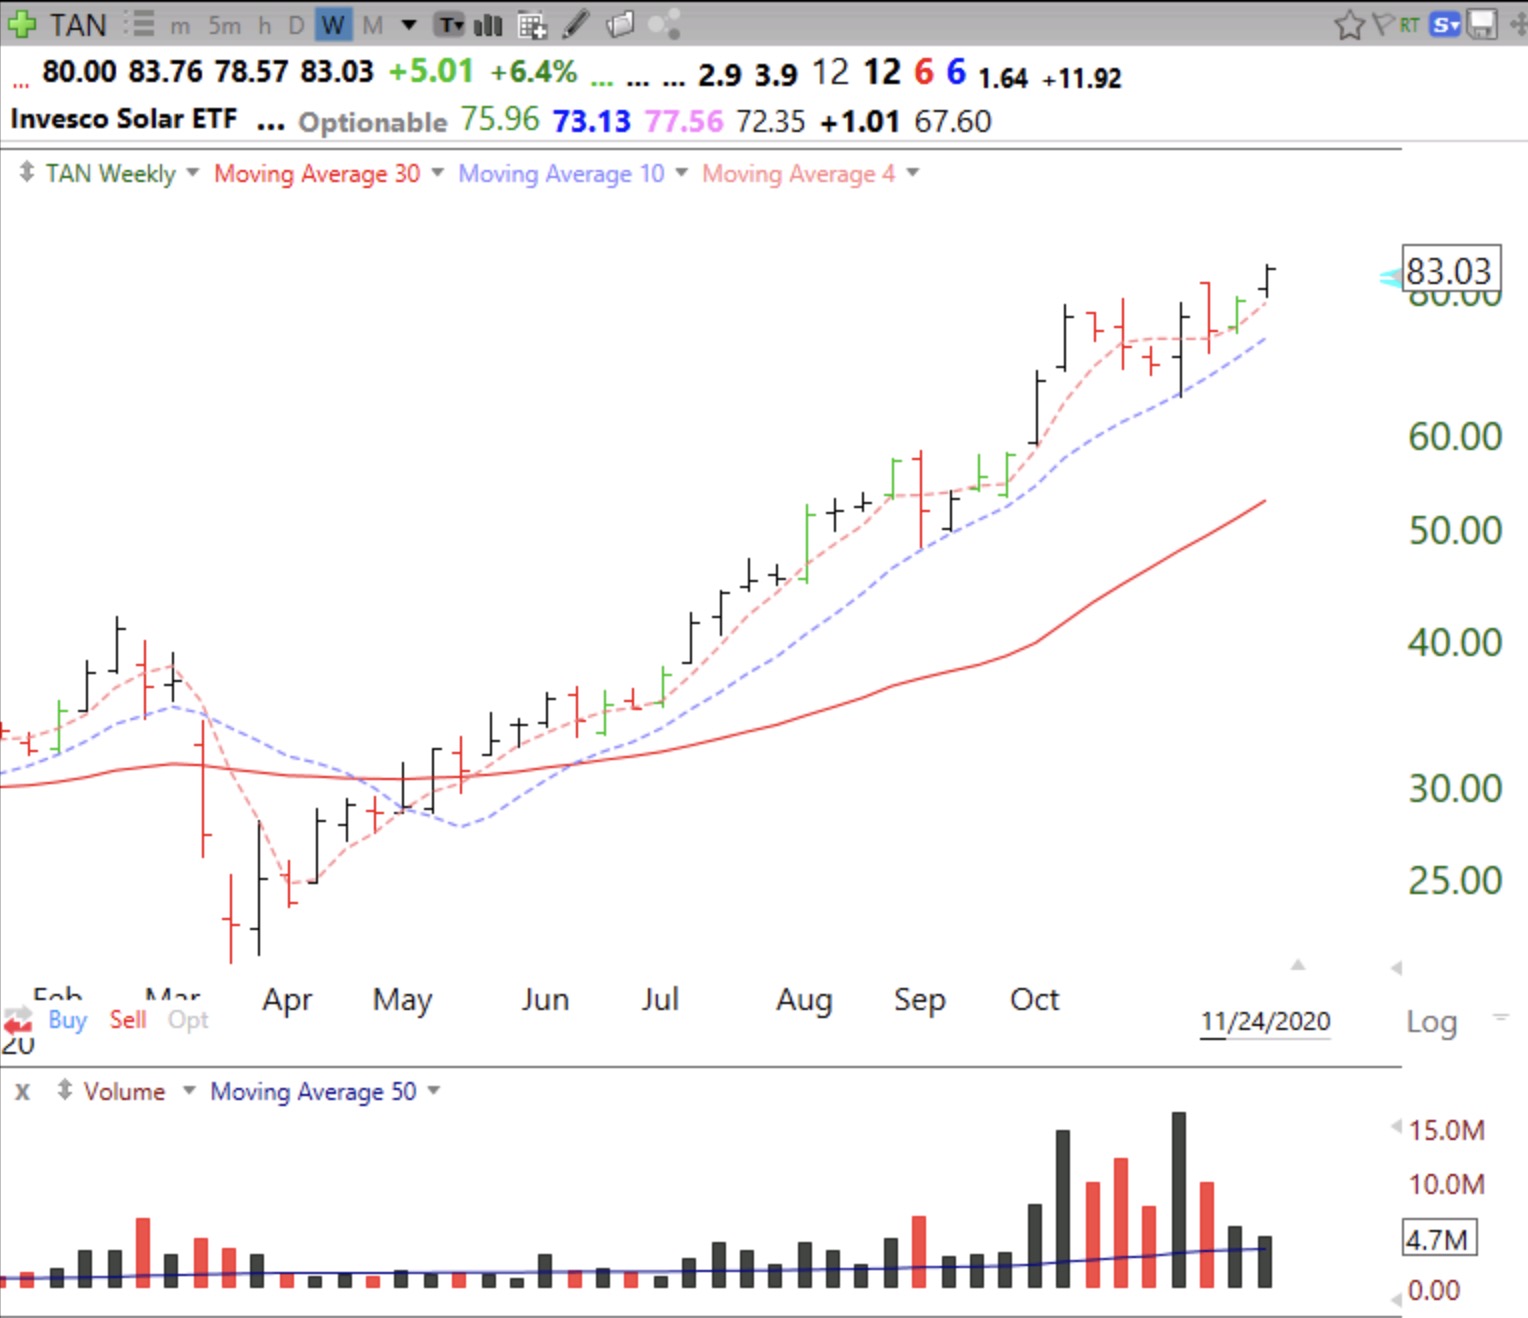
Weekly chart shows consistent up-trend with black volume spikes. Note the seven WGBs (weekly green bars) for accumulating a position. Share this: Click to email a link to a friend (Opens in new window) Email Click to share on Facebook (Opens in new window) Facebook Click to share on X (Opens in new window) X Click to share on LinkedIn (Opens in new window) LinkedIn Click to print (Opens in new window) Print More Click to share on Pocket (Opens in new window) Pocket Click to share on Pinterest (Opens in new window) Pinterest Click to share on Tumblr (Opens in new window) Tumblr Click to share on Reddit (Opens in new window) Reddit Click to share on Telegram (Opens in new window) Telegram Click to share on WhatsApp (Opens in new window) WhatsApp Related