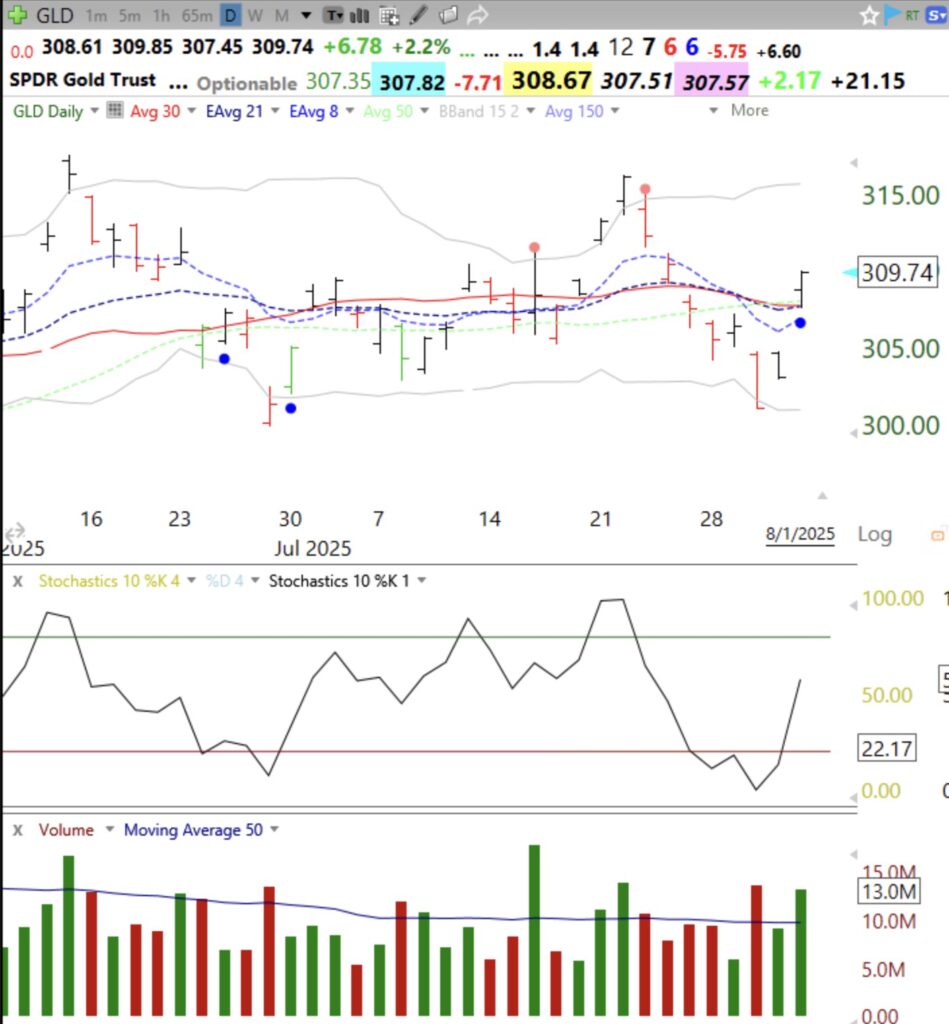
I had written on Thursday after the 8 EMA support line was violated, that I was becoming more defensive, and then we had a tough day on Friday. QQQ and SPY declined on heavy volume. A flat or down day on Monday would begin a new QQQ short term down-trend, after 68 days. If we then break below the green line it would constitute a failed GLB. This chart shows that the 10.1 daily stochastic is well below 20 (5.88), which is very oversold. It needs to turn up above 20 to trigger a blue dot, like it did on June 23 at the start of this nice rise and a GLB (green line breakout). QQQ is also resting on its lower 15.2 Bollinger Band, which could serve as support. Also, when Mag 7 stocks report earnings and have steep declines (META, MSFT, AMZN, AAPL) it does not bode well for the growth stock market. With the dollar declining with interest rates, GLD may be the place to be. GLD bounced off of its lower 15.2 daily BB and had a blue dot on Friday, see daily chart.
The GMI is at 3 (of 6) and could decline to 2 on Monday. Note how many of the short term components in GMI2 are negative. I am cautious and defensive until this decline ends.