Last August I wrote that I saw a possible head and shoulders top pattern forming, but the market broke above the right shoulder and moved higher instead. I have drawn in another possible head and shoulders pattern in QQQ that has been forming. This week we will see if it is resolved like the earlier one, or is really a top. The steep decline on October 10, noted by an arrow on this chart, occurred with the largest trading volume in months and is very troubling to me. But our job is to react and not to predict. So let’s see what this earnings filled week brings. A close below 589.05 would be a sign of extreme weakness. I am ready to go long or short once this pattern is resolved.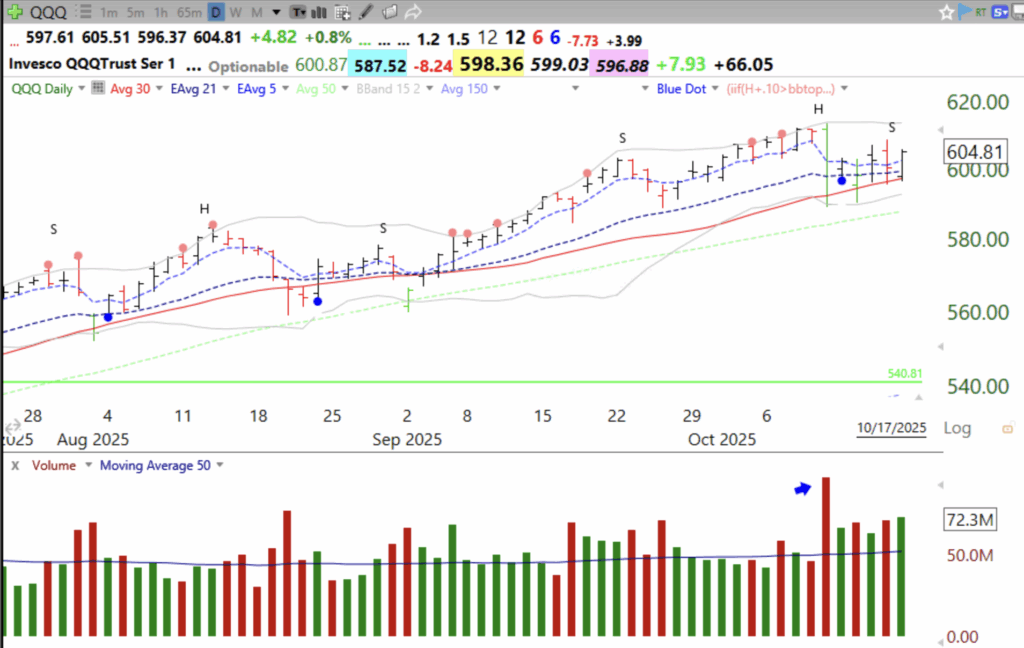
The GMI=4 but is still Green.
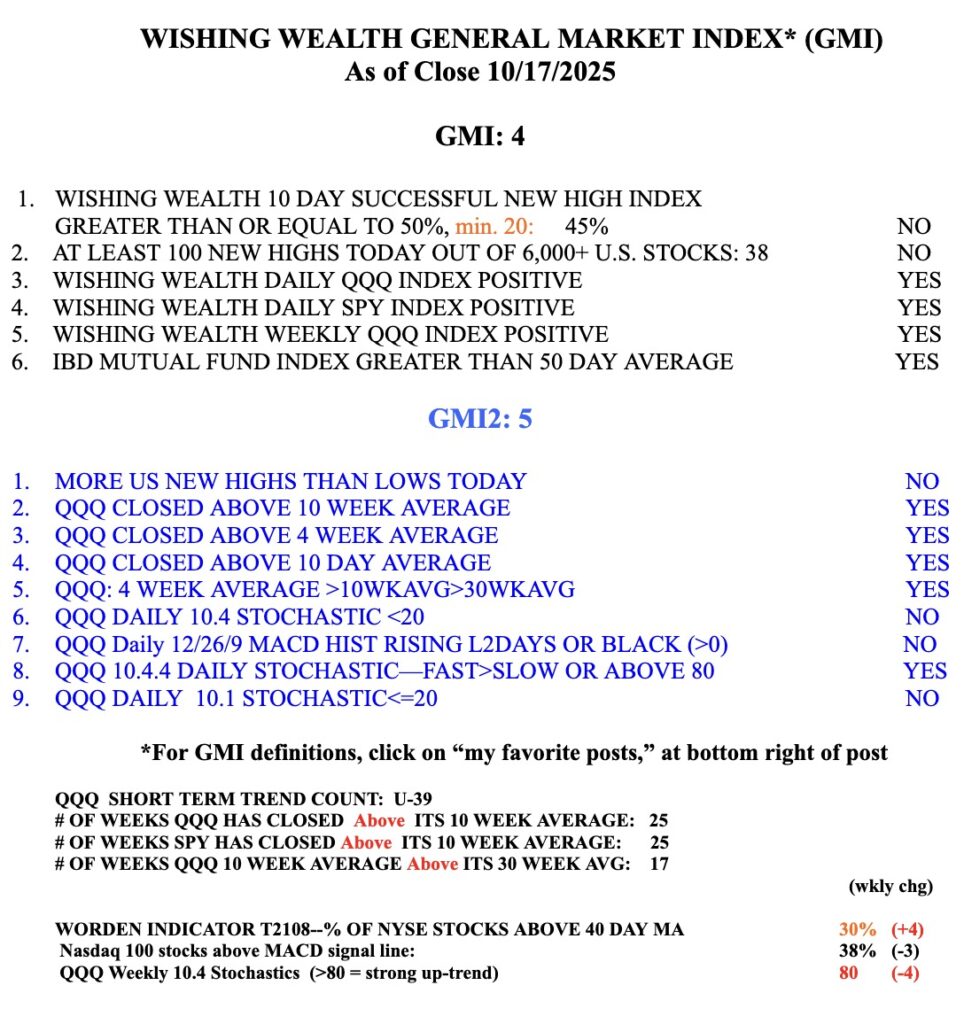
Market breadth is indeed concerning. Looking for profit taking opportunities in the past week. I’m still in the metals bull market run.