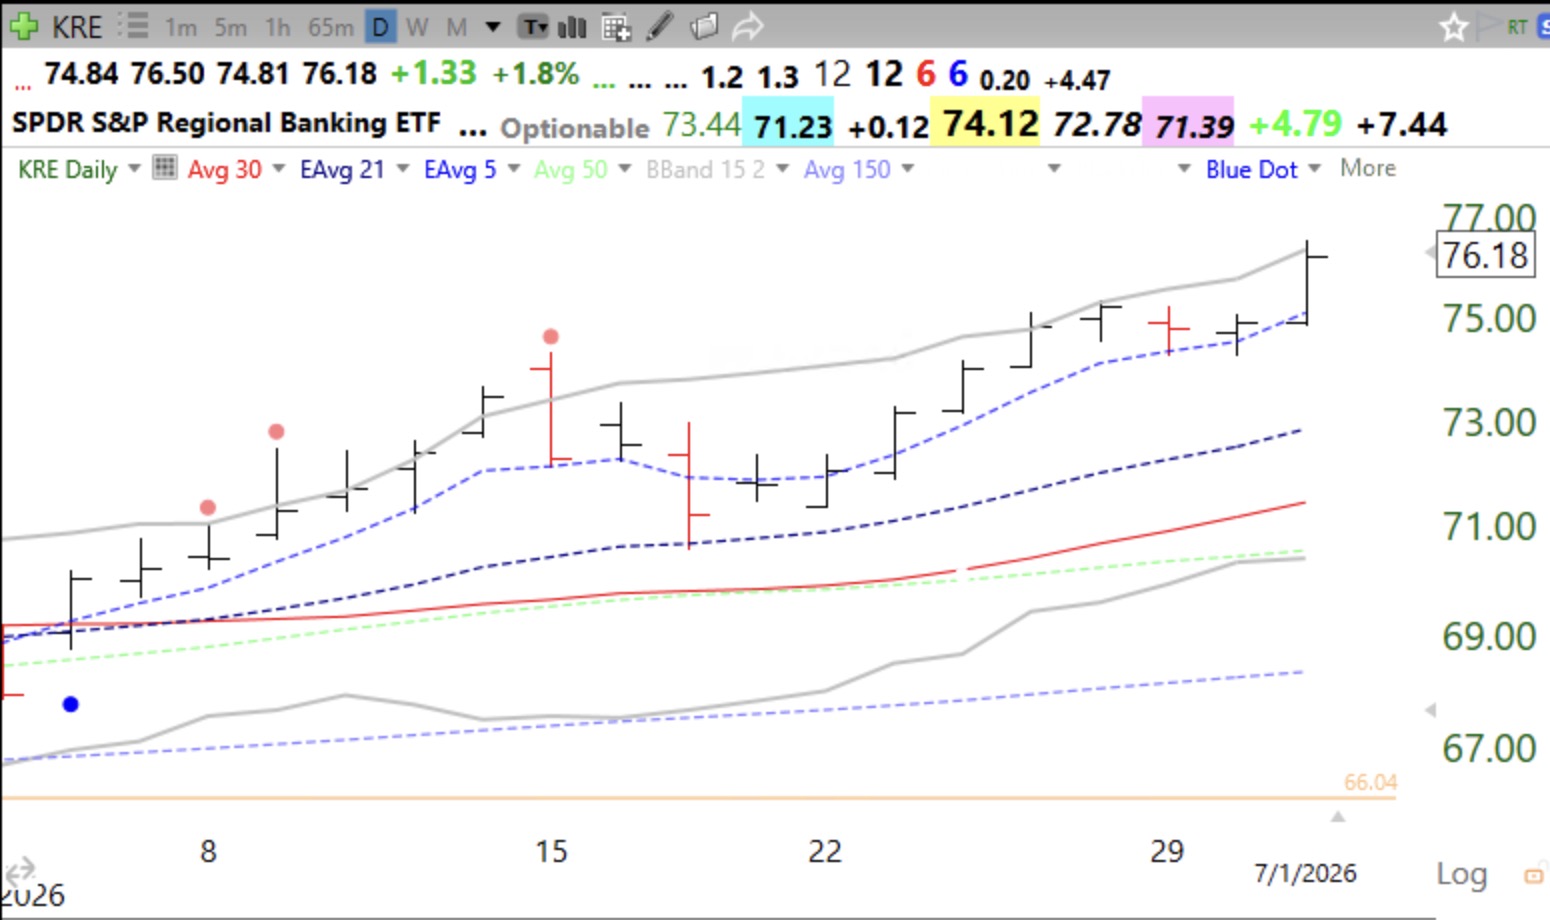
Maybe interest rates are going higher? More money for banks? Today was Day 2 of the new QQQ short term up-trend. I do not know if it will last with the turn away from tech stocks. Happy and safe 4th!
Stock Market Technical Indicators & Analysis
Maybe interest rates are going higher? More money for banks? Today was Day 2 of the new QQQ short term up-trend. I do not know if it will last with the turn away from tech stocks. Happy and safe 4th!
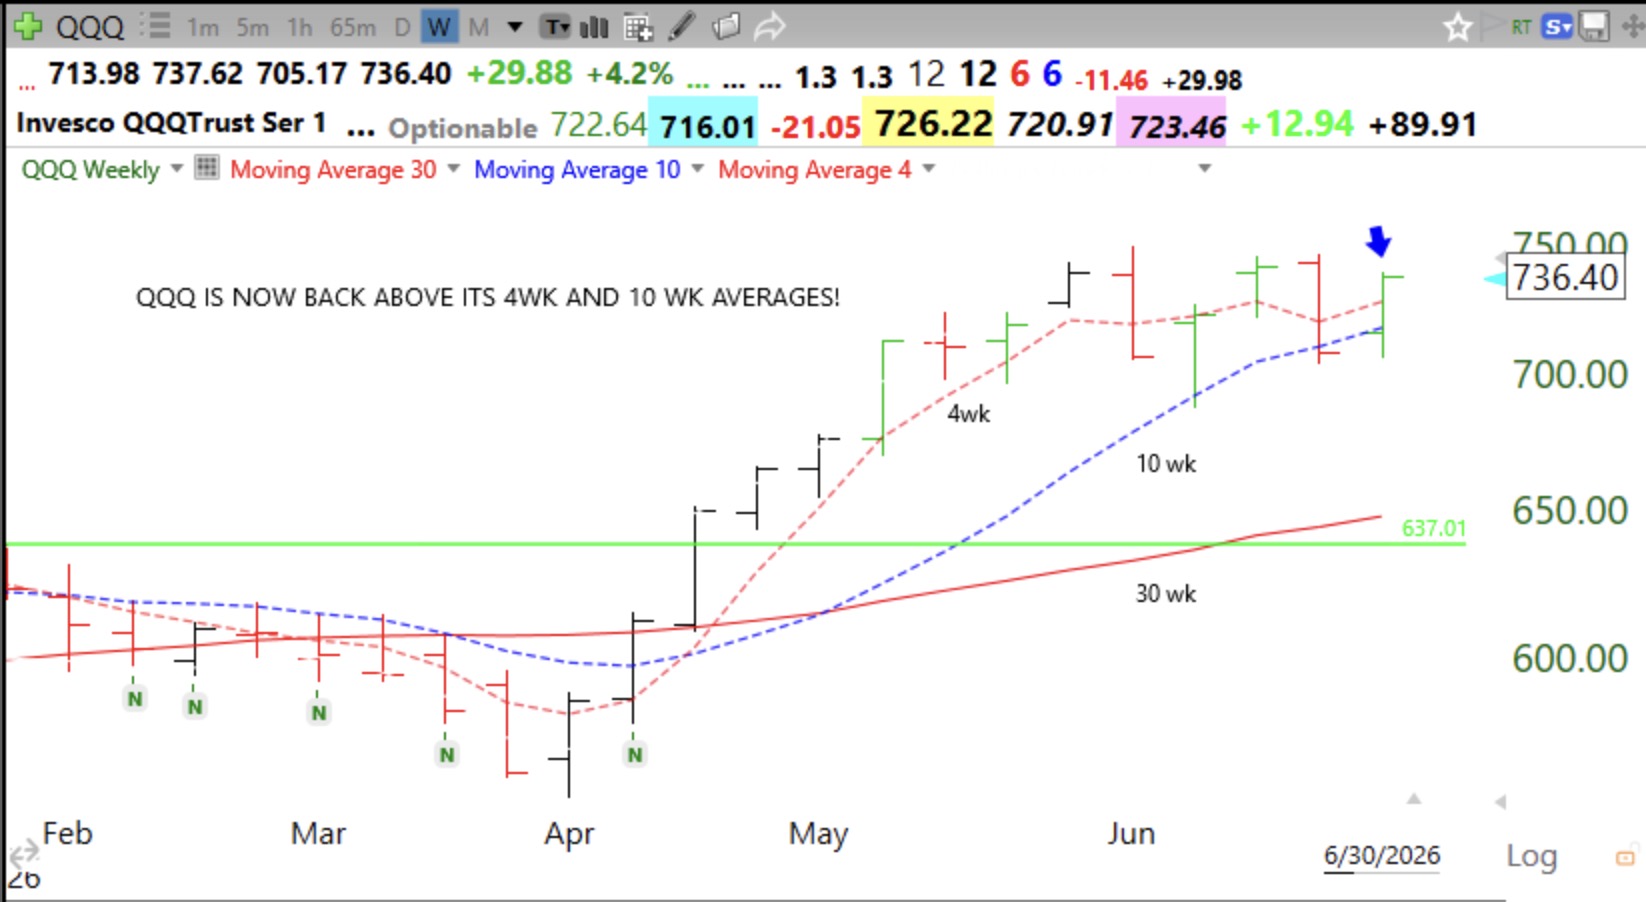
I have written before that about 40% of QQQ short term down-trends do not last 5 days. I therefore buy a little SQQQ on Day 1 and wait to see if the down-trend continues. I sold SQQQ and bought some TQQQ today and will accumulate more if the new up-trend continues. New short term up-trends are more often likely to continue. Remember, when a new short term up-trend begins it seems unreasonable and it is psychologically difficult to bet on it. Time will tell. But many of these up-trends last 50 or more days and give me plenty of time to get on board. QQQ needs to break through its recent tops to all-time highs. And 2nd quarter earnings are coming.
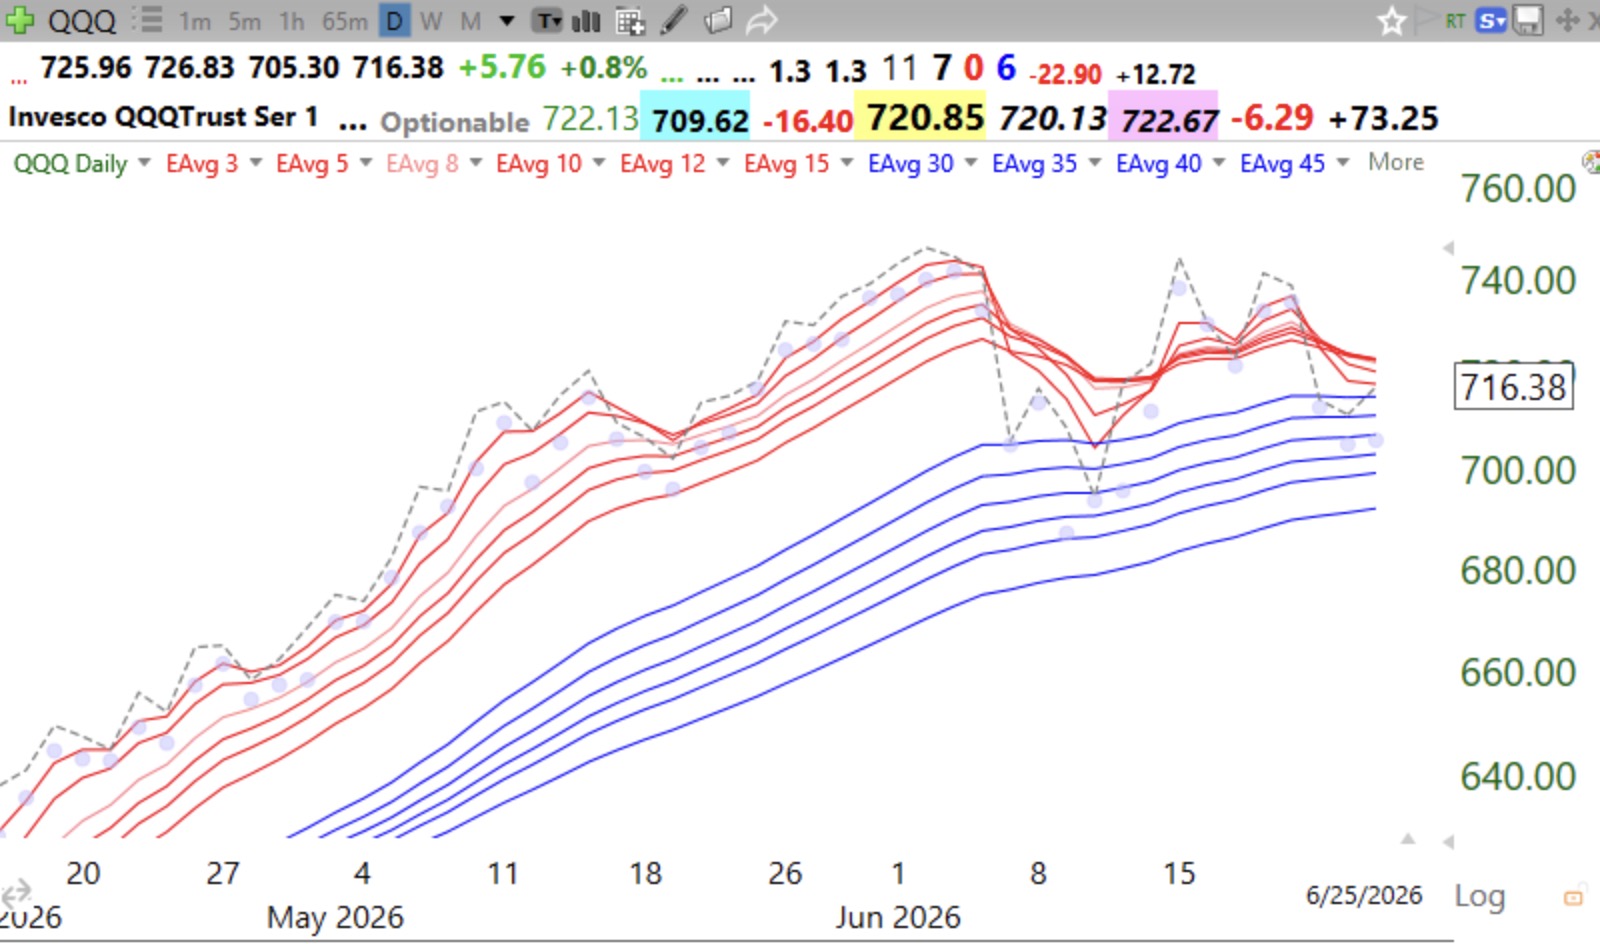
We had many US stocks at 52 week highs and at ATHs on Thursday. But QQQ and SPY are weakening.The daily Guppy chart shows the lateral movement in QQQ, compared with the nice prior up-trend. In early July, when 2nd quarter earnings come out we may see a rise, or we may not. Just in case, I nibbled at SQQQ. Time will tell.