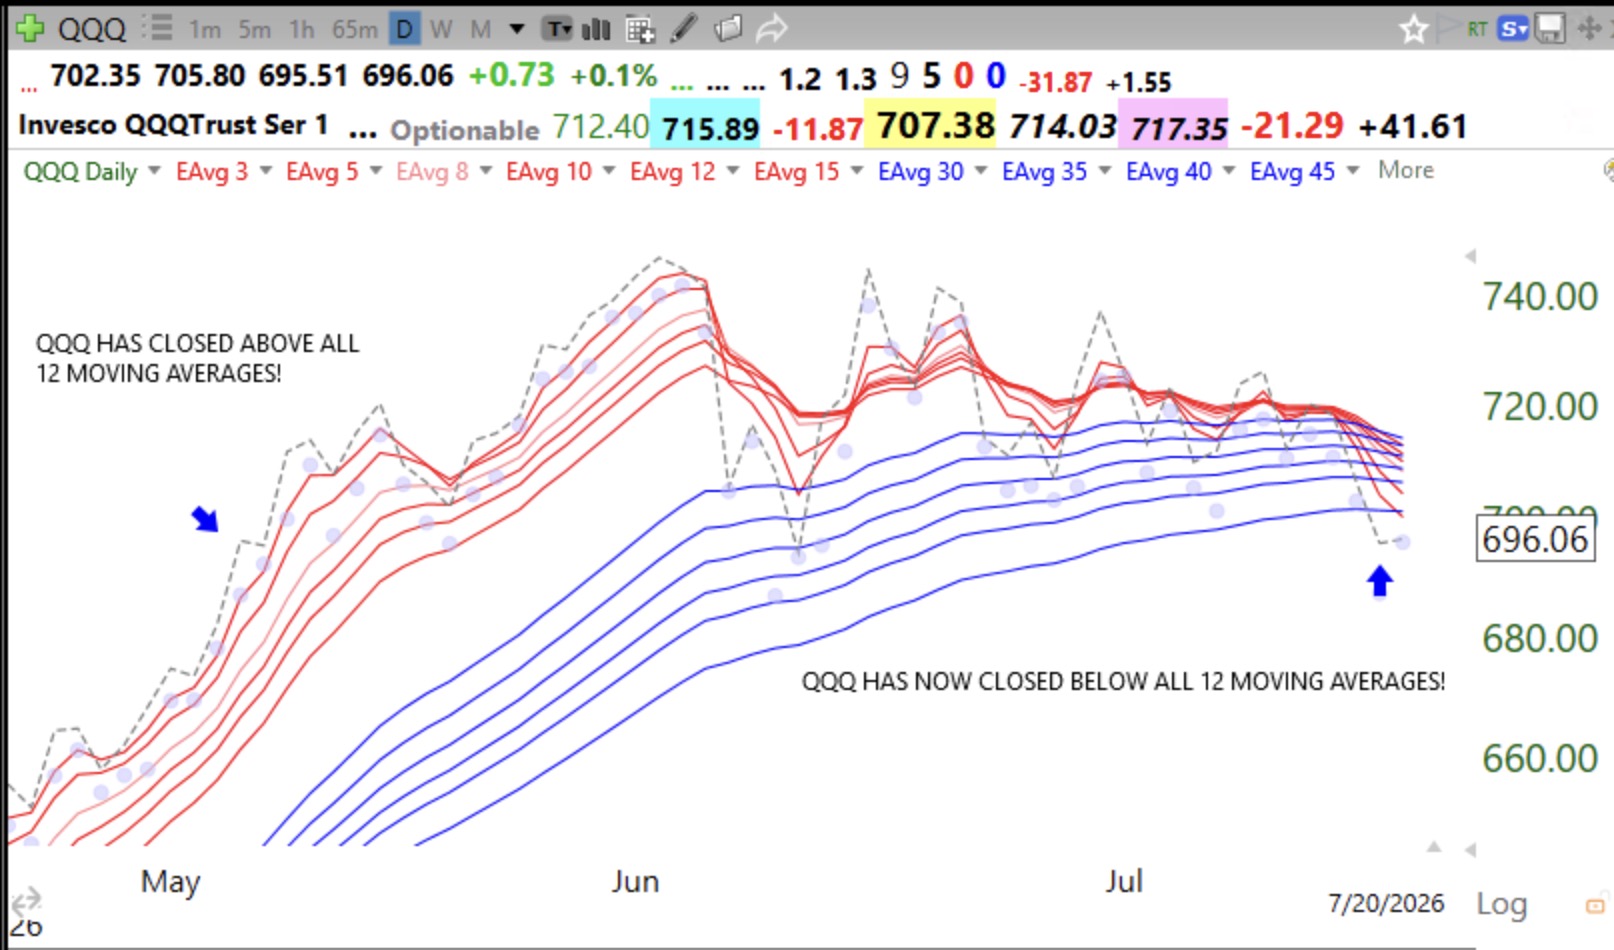
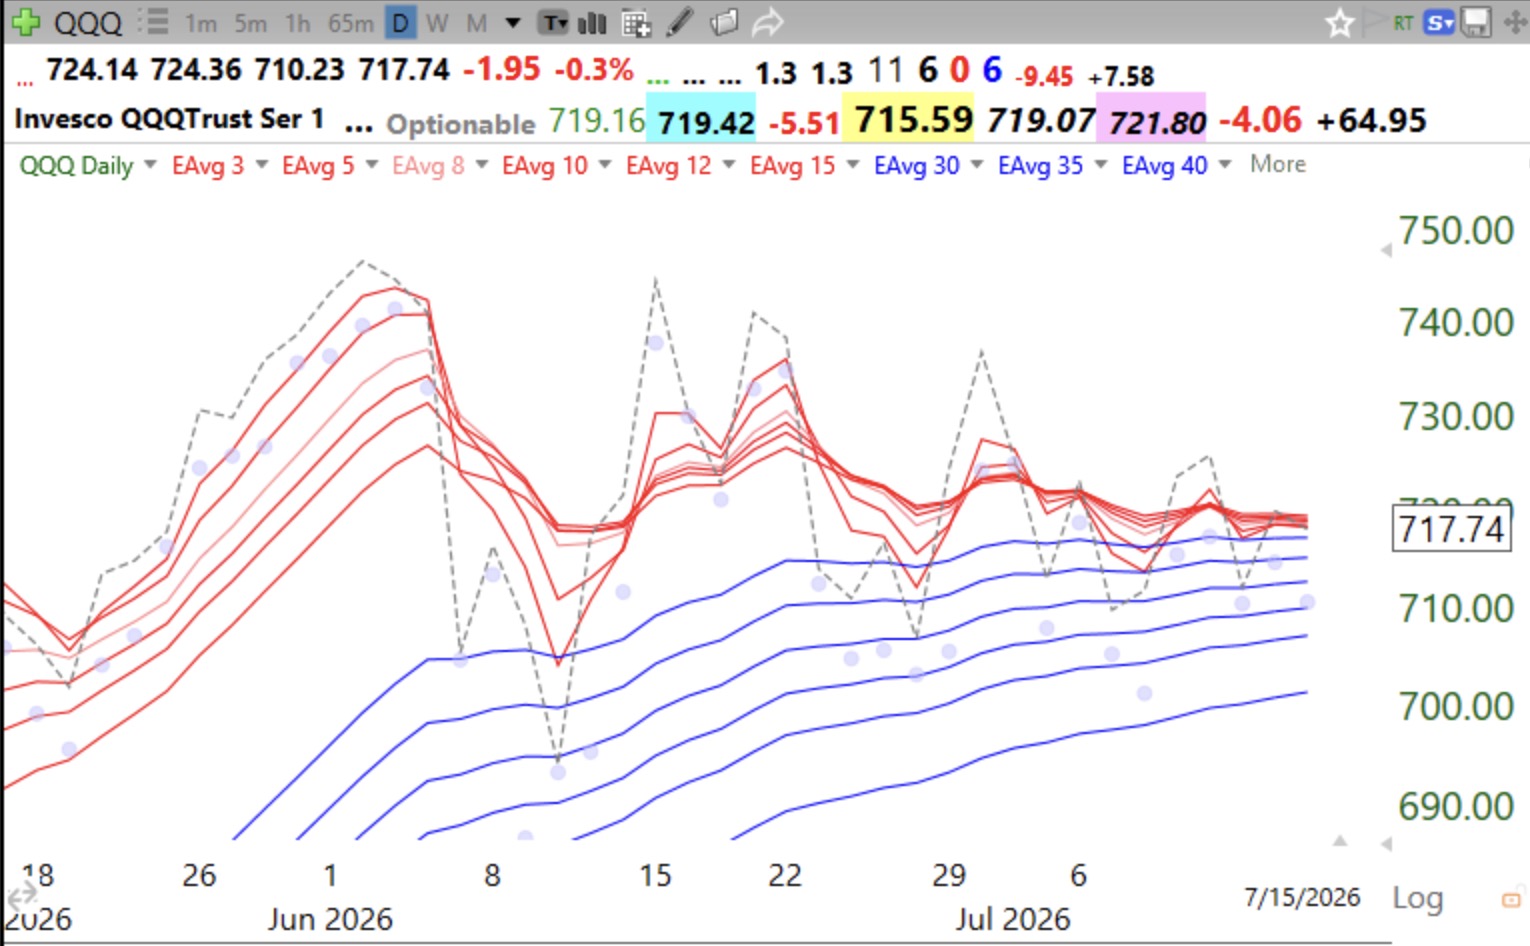
I am very worried about the strength of the current market. There are times for me to step away. If growth stocks announcing good earnings this week weaken, I fear that the markets are in for a steep decline. Too many young persons who have only been trading for a short time will learn the hard way that minimizing losses is the key to success. This modified daily Guppy chart shows that QQQ is leading all 12 moving averages lower. The dotted line shows daily closes. A new advance will occur when the reverse happens. Look at the pattern last May during that wonderful rally. That is what I am waiting for. I ignore the news and the media pundits and follow the market’s actions.