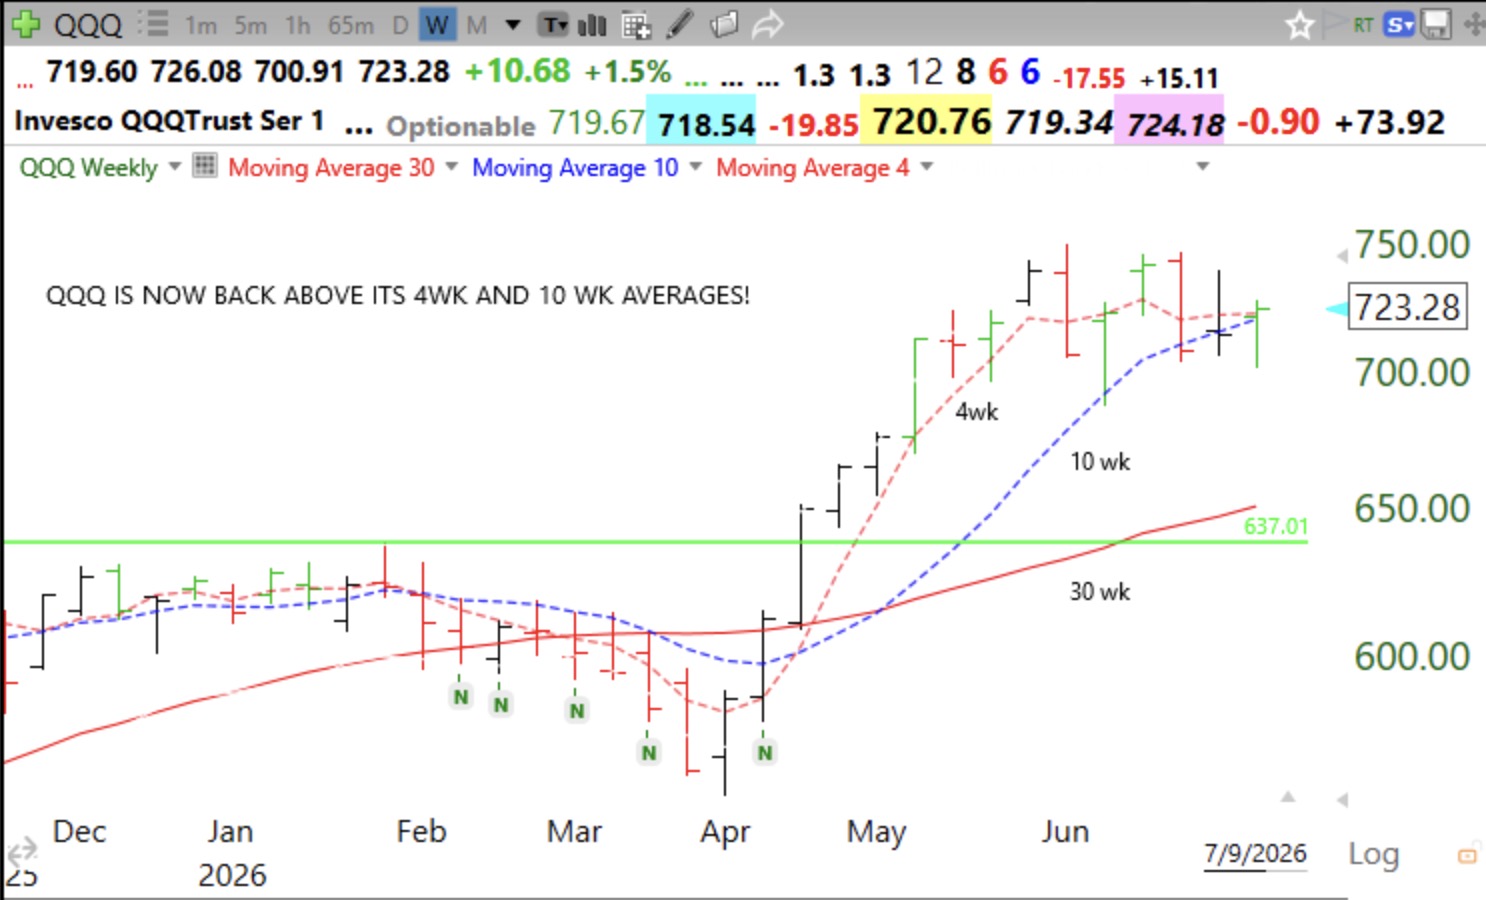
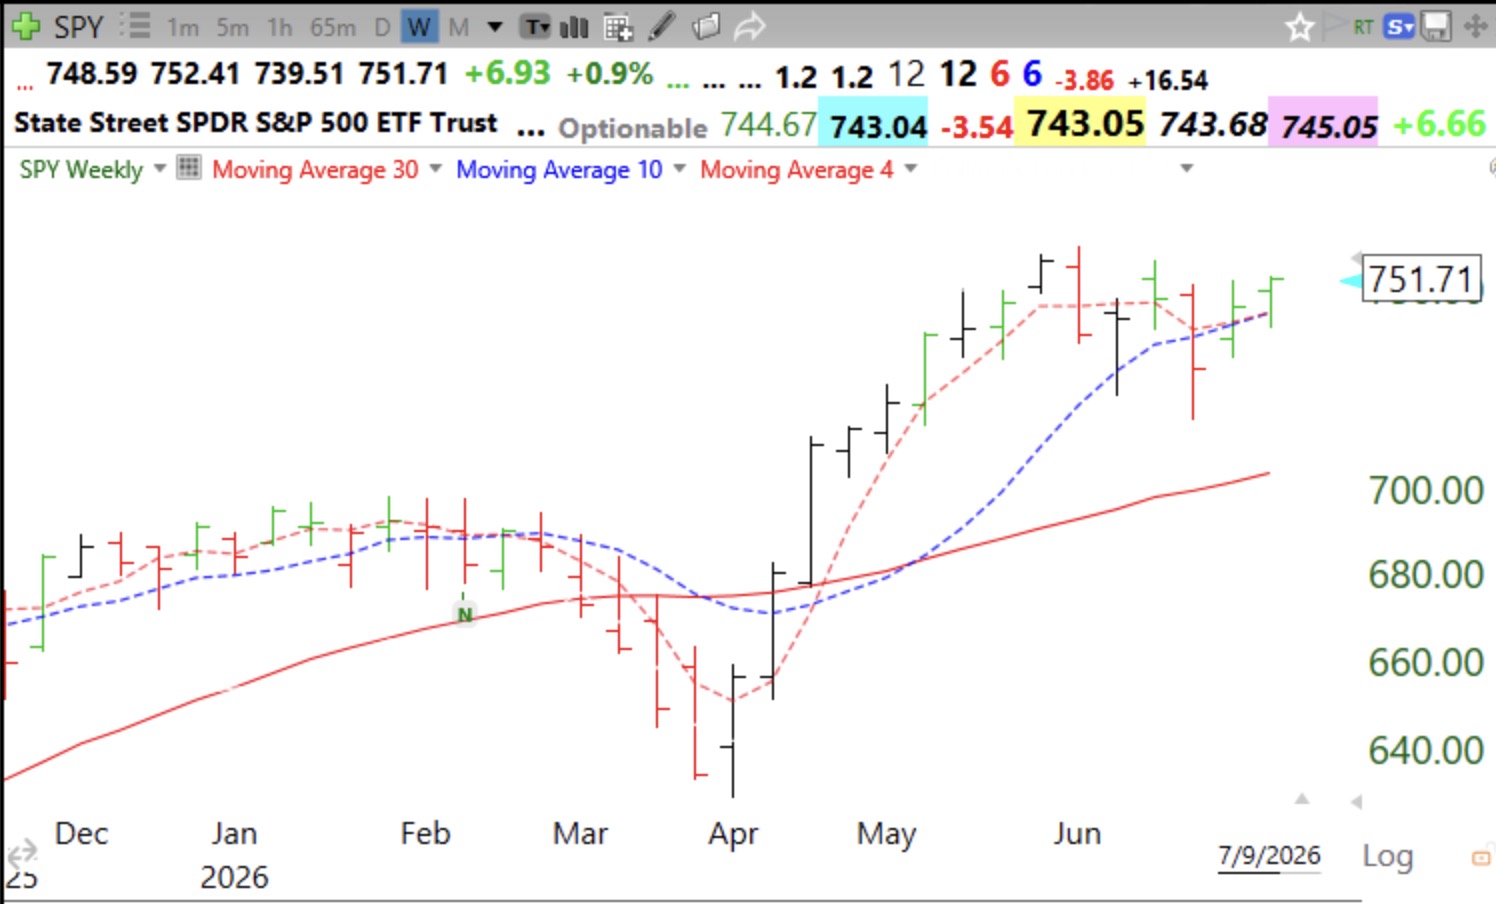
This weekend we shall see if this comeback has held. I focus largely on QQQ which reflects tech and growth stocks. SPY has been somewhat stronger recently, only closing below its 10 week average one week, see its weekly chart.
Stock Market Technical Indicators & Analysis
This weekend we shall see if this comeback has held. I focus largely on QQQ which reflects tech and growth stocks. SPY has been somewhat stronger recently, only closing below its 10 week average one week, see its weekly chart.
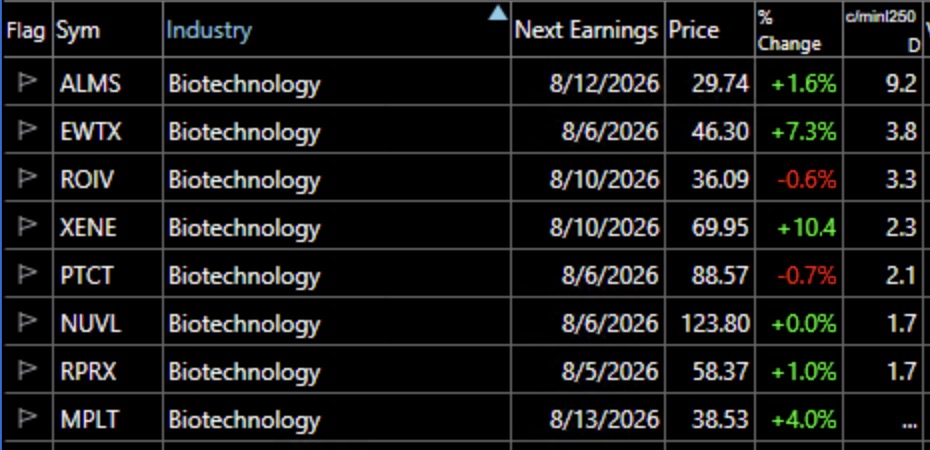
This list is sorted by close Wednesday divided by minimum low the past 250 days. MPLT has a null result because it came public within the past year and the division could not be calculated for its price over the past 250 days. ALMS is 9.2x its low the past year.
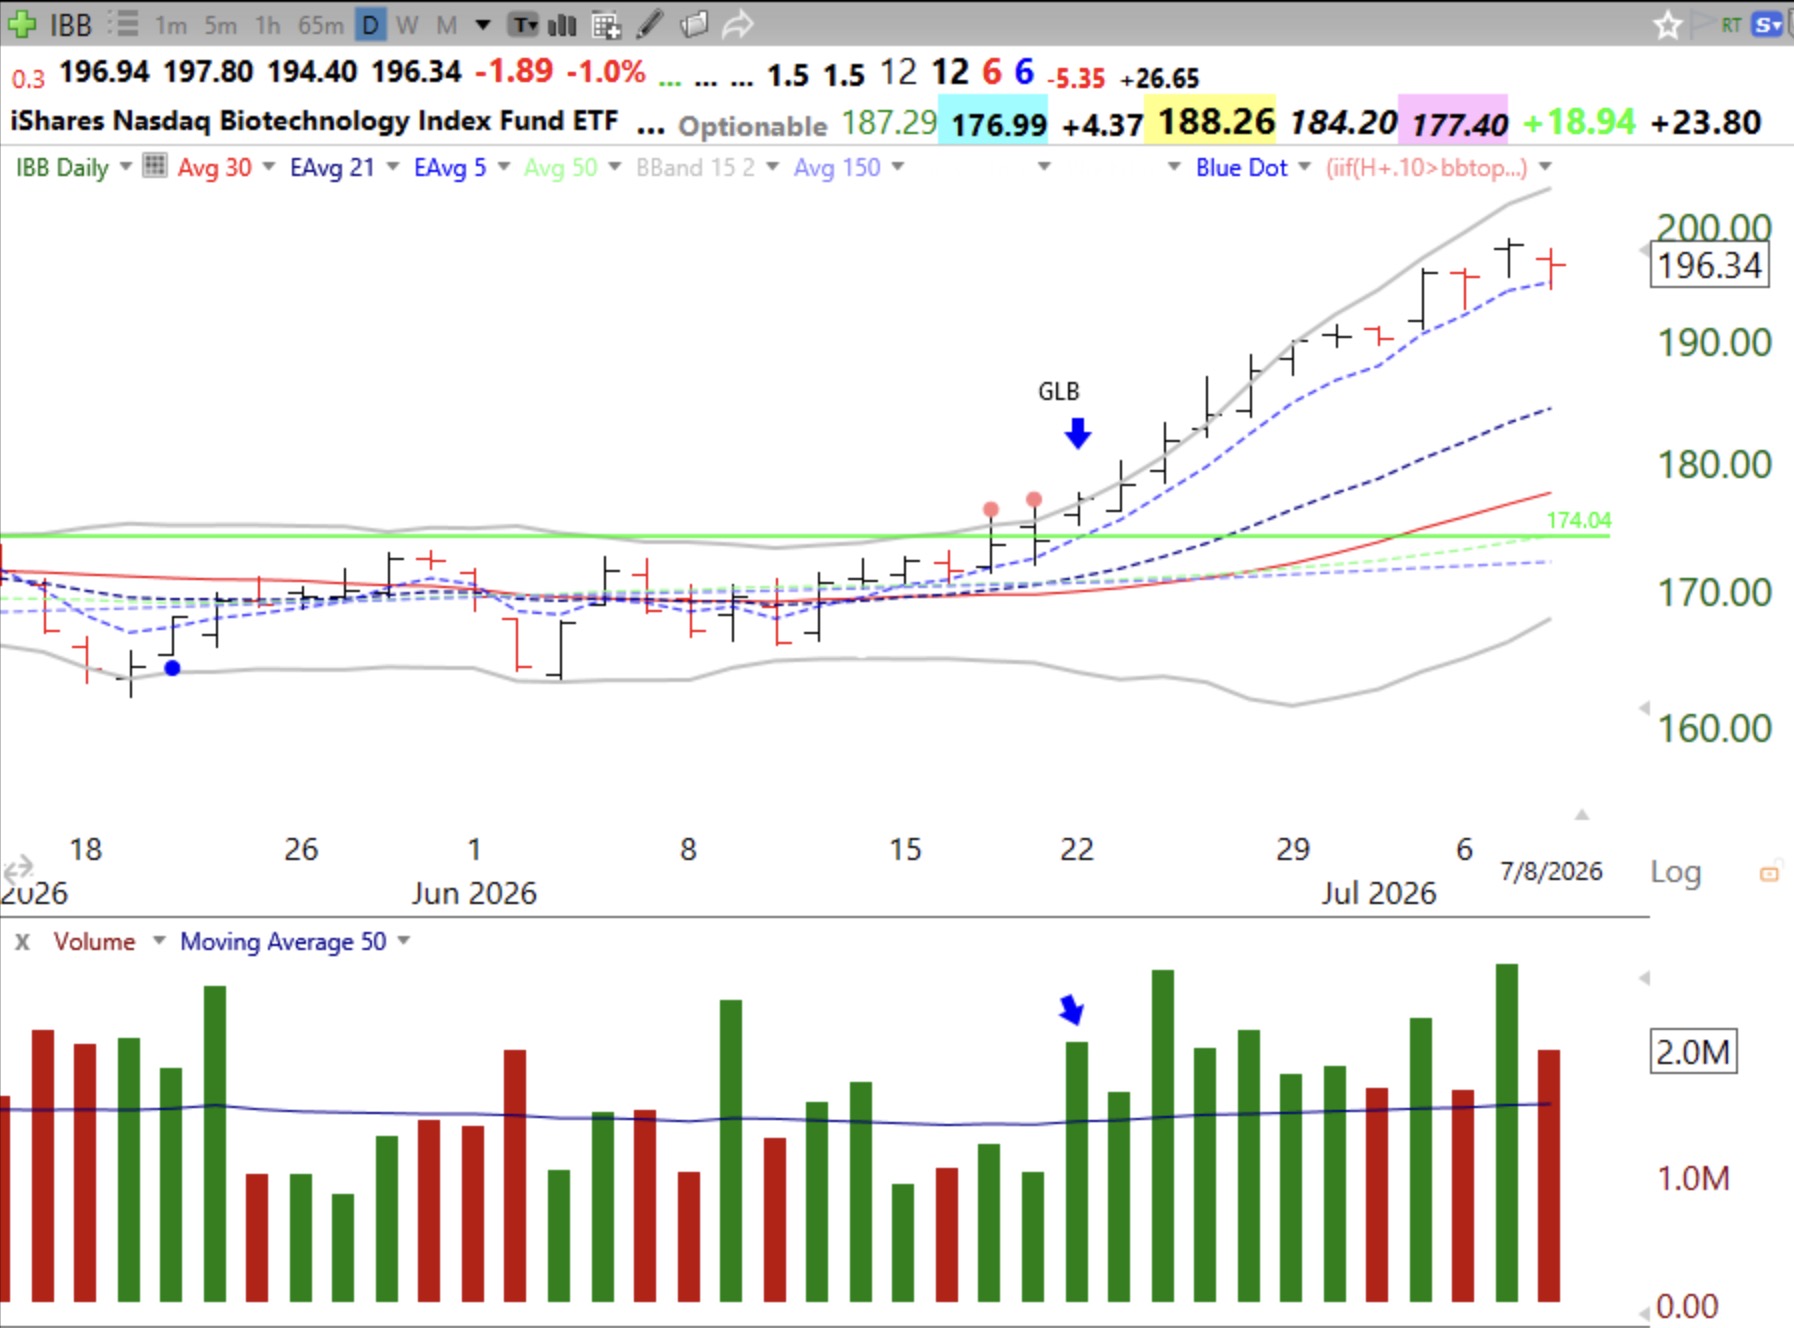
IBB had a high volume GLB on 6/22. Note how it is tracking its 5 day EMA.
I own a little SQQQ and am mainly in cash in my trading accounts. I have been whipsawed many times the past 2 weeks. This is not the time for me to place large bets.
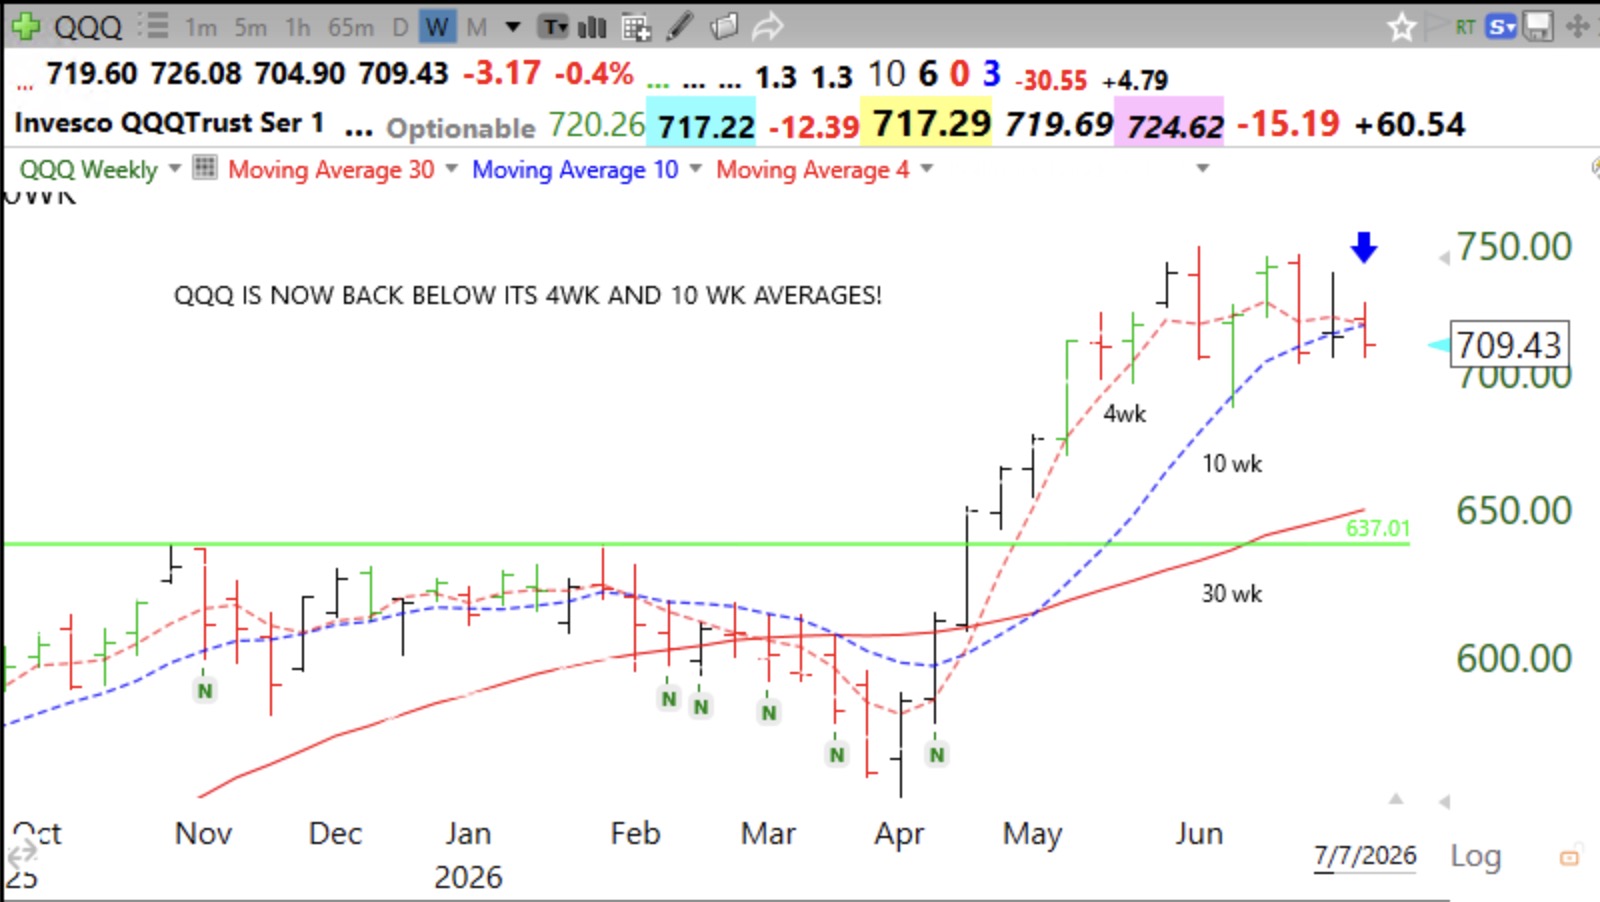
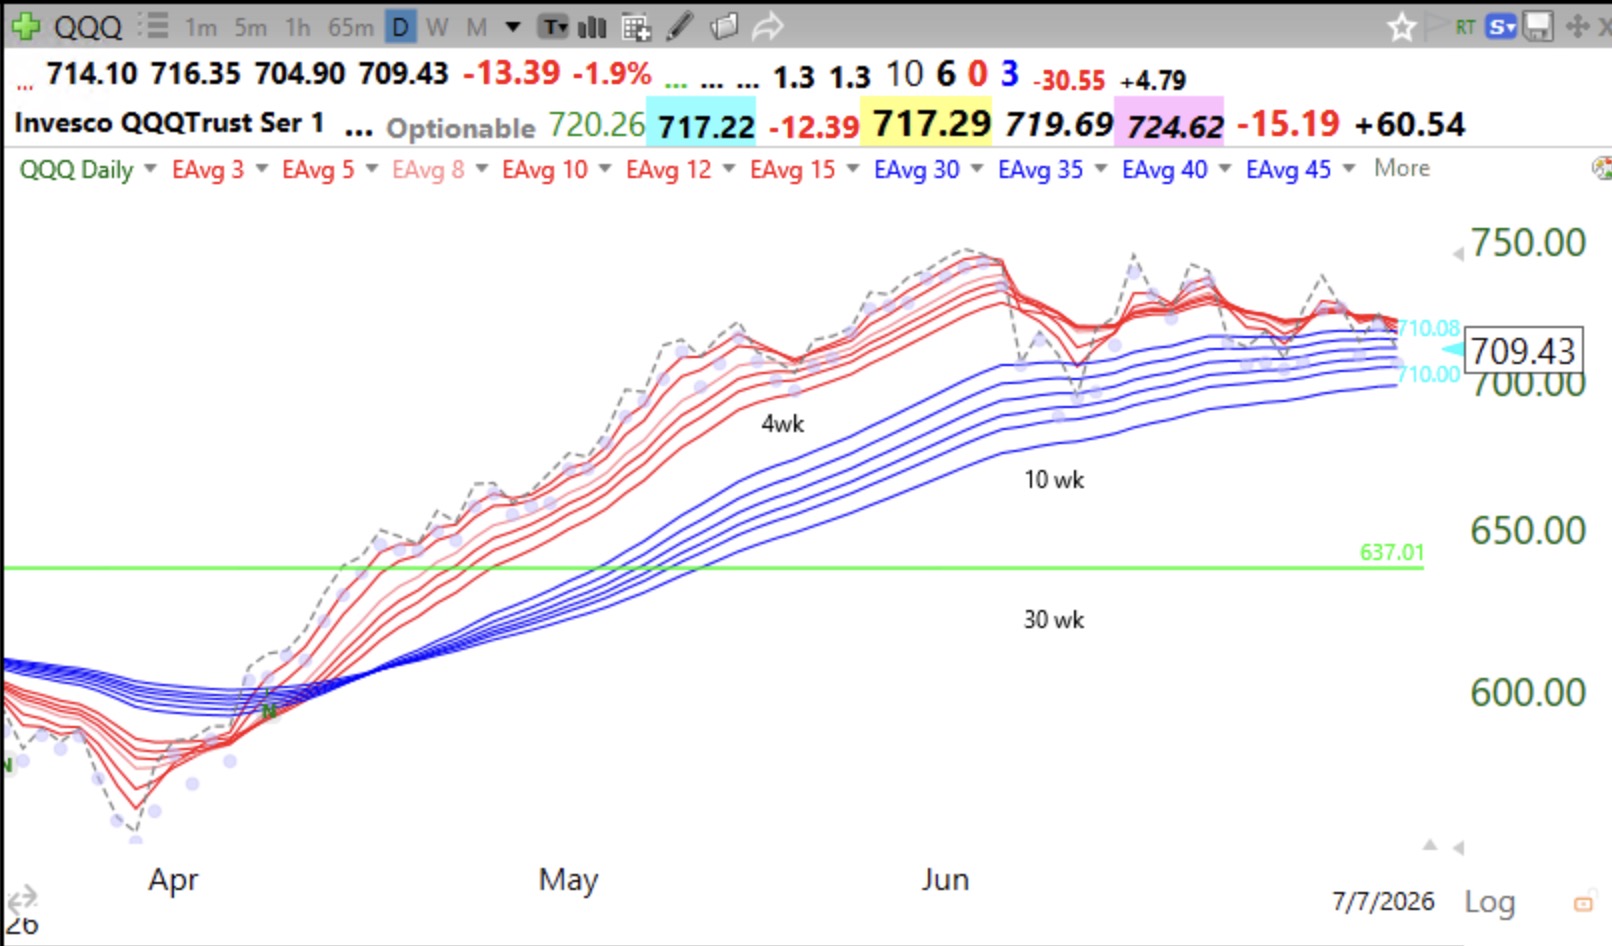
The daily modified Guppy chart shows the lateral back and forth moves in QQQ since early June. It was so easy to trade profitably going long during the prior RWB up-trend when QQQ closed above all 12 averages almost every day (dotted line shows closes). I am waiting for the break out, up or down, from this pattern.