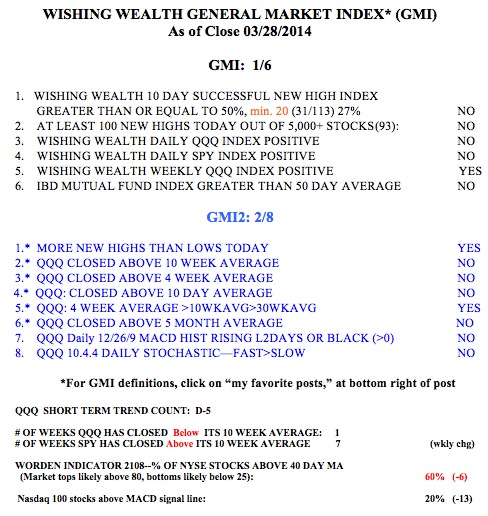
For the first time since December, 2012, the QQQ has closed the week below its 30 week average (solid red line). This is a serious sign of weakness that bears careful watching (pun intended). If the QQQ remains below its 30 week average so that the average itself turns down, it will signal to me the beginning of the end of the Stage 2 up-trend and possibly lead to a Stage 4 market decline. Only time will tell me whether this is happening. A trend follower must wait for the top to be in and for a significant decline to begin. I cannot therefore avoid giving back some gains. Since the bottom of the steep 2008 decline, there have been 4 multi-week periods where the QQQ was below its 30 week average. All of them were resolved on the up-side. It is impossible for me (or anyone else) to accurately predict in advance how this one will turn out. But this one comes after a rare 30% advance last year, coming after a multi-year advance.
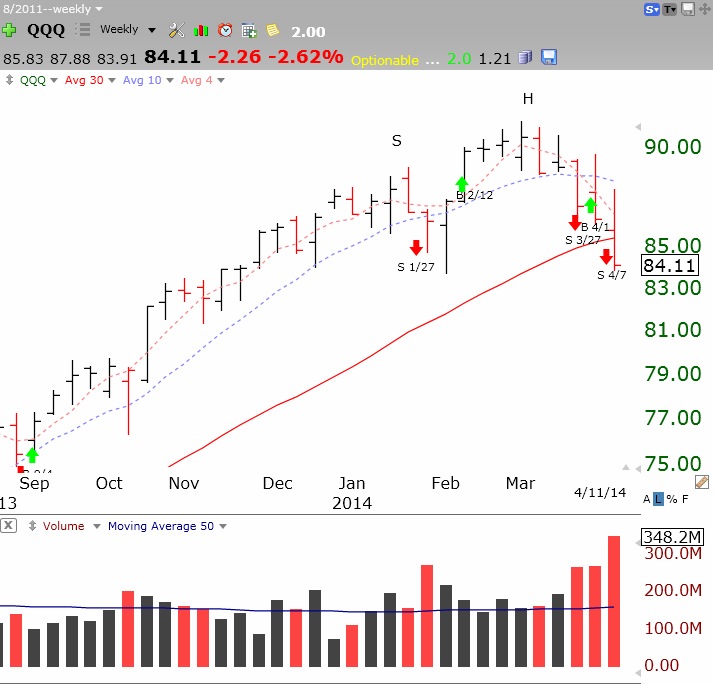
Given that the QQQ has completed its 15th day of a short term down-trend and that the GMI is on a Sell signal, I have withdrawn all funds from this market in my more speculative trading accounts. I remain invested 100% in mutual funds in my university 401 (K) account, for now, because of strict trading limits imposed by the fund group. Nevertheless, if the QQQ closes several weeks below its 30 week average I will reluctantly consider transferring some of the money out of the growth equity mutual funds and into a money market fund. If I had complete freedom to go in and out, I would have already taken some of that aggressive mutual fund money off of the table. In fact, if the QQQ rallies back to around 89, I will likely go ahead and transfer some money out of the growth mutual funds. If we get a rally to that area and it should fail, I fear a possible head and shoulders top will form leading to a significant subsequent decline. I have labeled the possible left shoulder (S) and head (H) in the chart above. It is critical that the next rally in the QQQ continue through the level of the left shoulder (89) and approach and eventually surpass the prior peak (91.36). A failure to do so would signal to me a major decline is imminent. An up-trend consists of a series of higher lows and higher peaks. It is critical for me to watch closely but to not become attached to any expected scenario. The market has to tell me what its intention is before I act…..
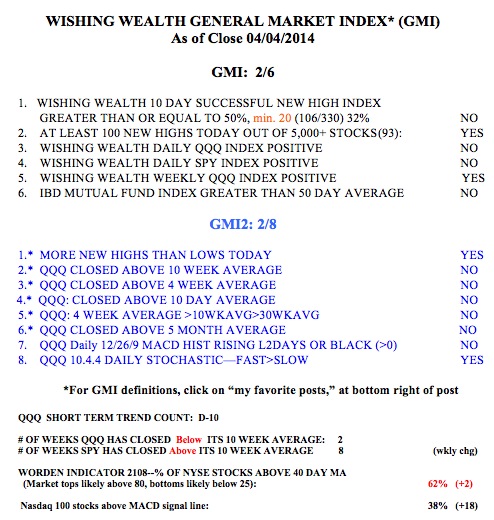
According to IBD the market remains in a correction. They also said in Monday’s edition that the Put/Call ratio was 1.15 on Friday. A ratio of at least 1.2 usually indicates extreme bearishness among the option players (more puts being traded than calls) and the market often bounces. And my other daily indicators are very over-sold. If a lot of people lick their wounds over the weekend and decide to sell at the open on Monday morning, we could get a solid bounce afterwards. But the Worden T2108 indicator is only at 41%, far above the level where the market has bottomed in the past. And the weekly stochastic is also far from oversold. If the market bounces early next week, I would not expect it to hold for very long….
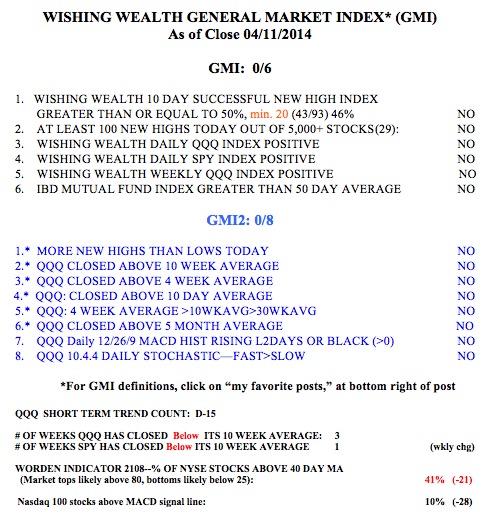
Note from the GMI table below that the SPY has finally closed below its critical 10 week average. The QQQ has spent 3 weeks below its 10 week average. It looks like the QQQ is leading the other indexes.