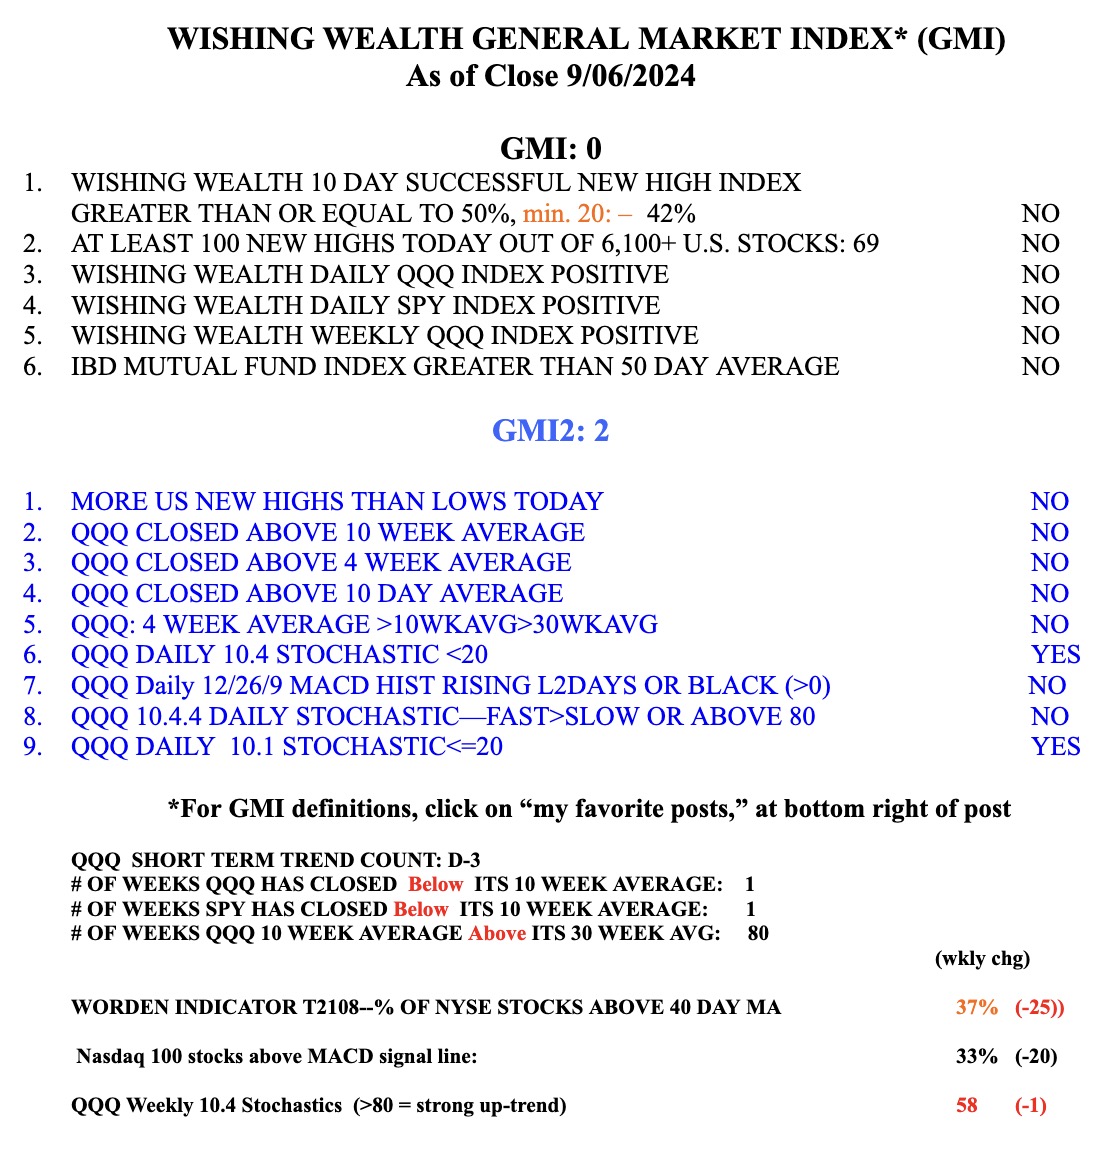
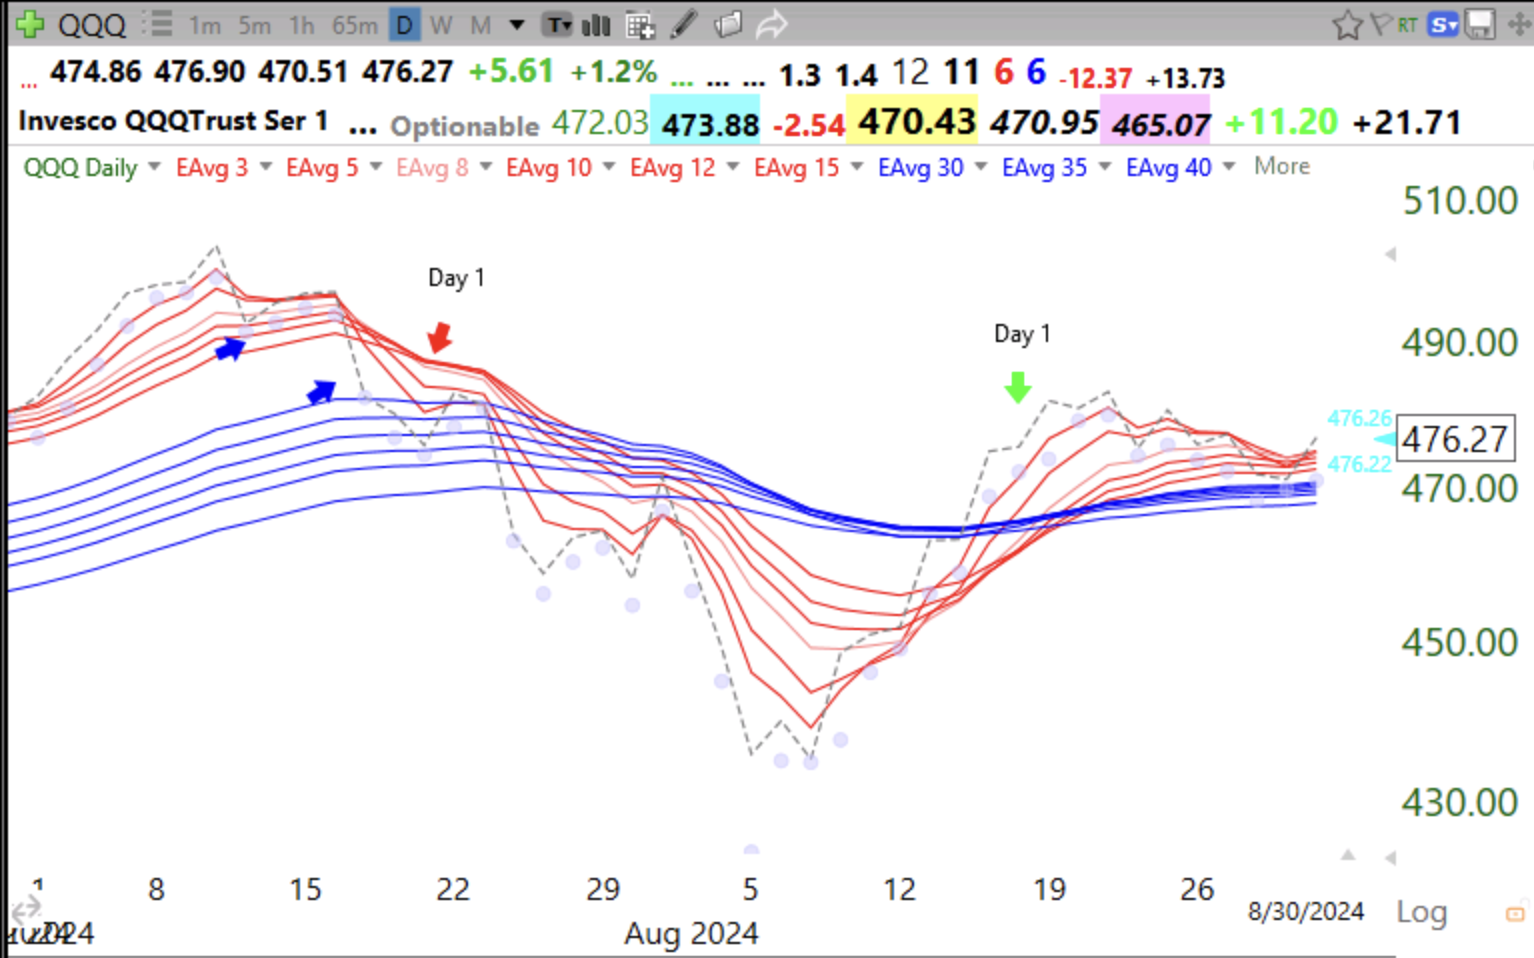
I cannot remember a time when the GMI declined so quickly. When it turns RED at Monday’s close, both of my short and longer term indicators for QQQ will be indicating a decline. While QQQ is now below its 10 week, 30 day and 30 week averages, it is still in a Weinstein Stage 2 up-trend, for now. The 10/30 weekly chart below shows this. If the 10 week average closes below the 30 week average and the 30 week average curves down, I will begin to exit the mutual funds in my conservative university pension accounts. In 2000, 2008 and 2022, a declining 30 week average helped me to exit the market BEFORE the real decline began. In the past, a reading below 10% in T2108 has been where markets have often bottomed.
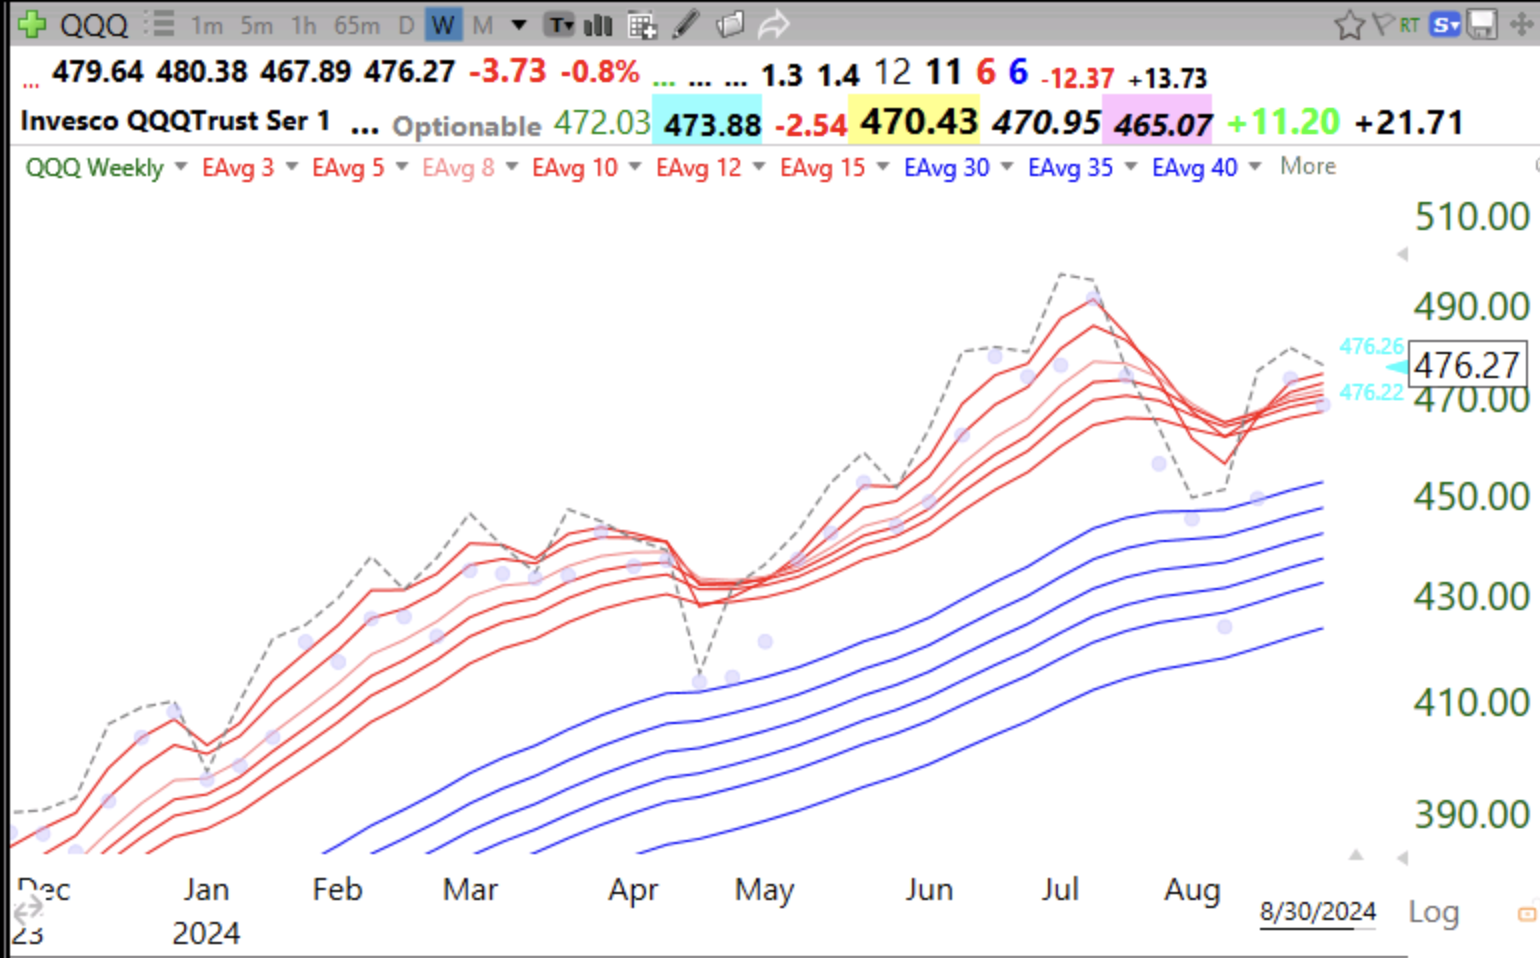
In this 10/30 weekly chart, the gray line tracks the weekly close, the dotted line is the 10 week average and the red line is the 30 week average.