I am sad to report that David died on 2/18 when the sailboat he and his daughter built in January capsized on a trip towards Baltimore amid huge winds. They both swam to shore but David died quickly of hypothermia and his daughter survived. This is a devastating loss to me, his family and my fellow colleagues. David began as the consummate librarian at my research center 20+ years ago and caught the passion for the stock market from me. He recruited TAs for the course, mentored them, managed the class, and arranged and ran all of my presentations about technical analysis. A skilled programmer, he surpassed me at running TC2000. He was a kind gentleman of 62 and will be deeply missed by all who had the privilege of interacting with him…..
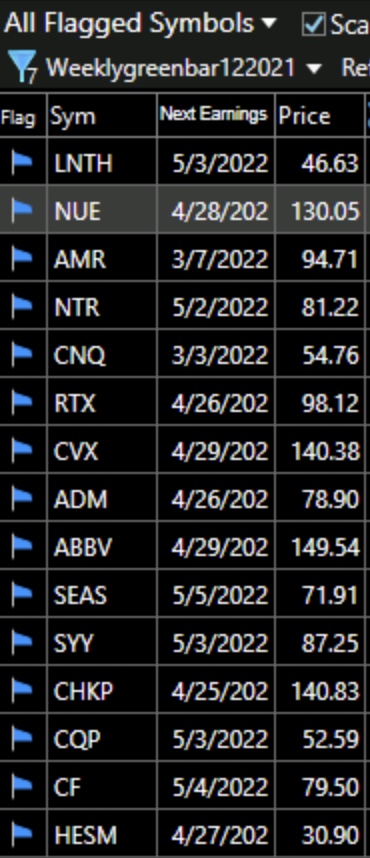
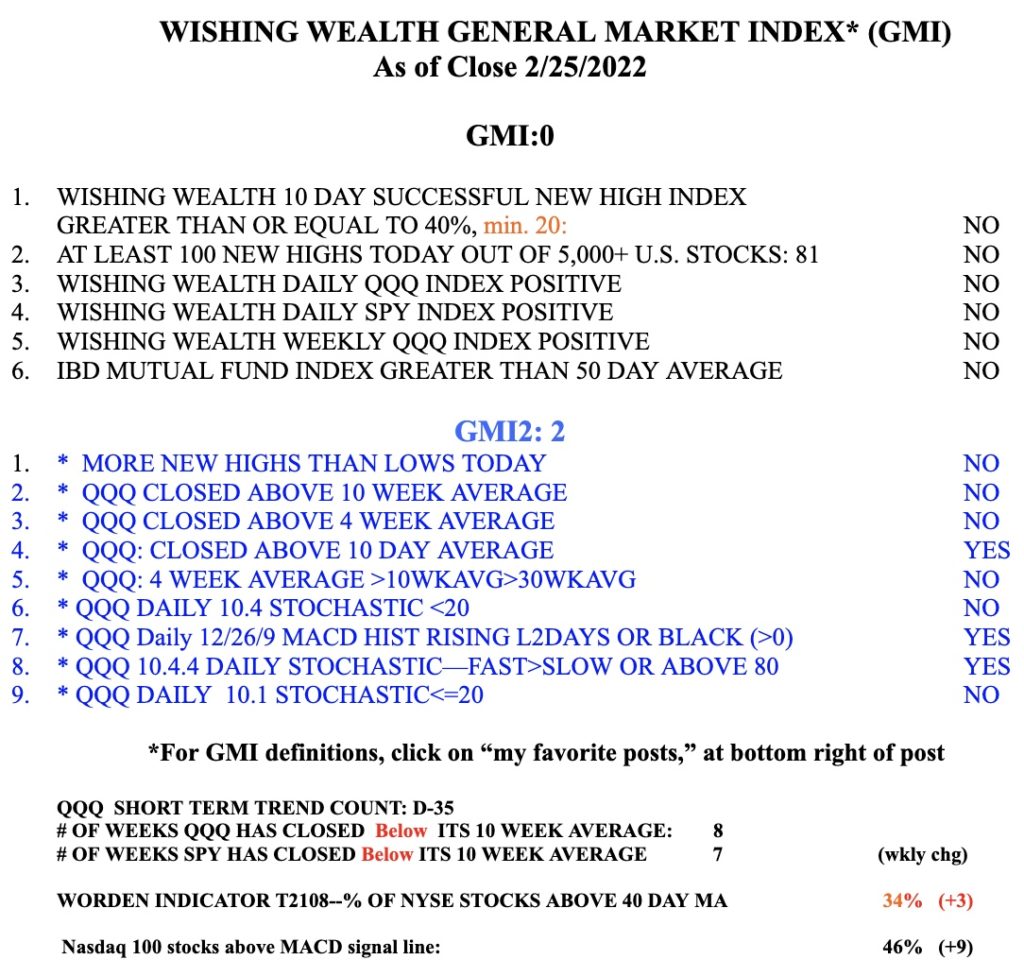
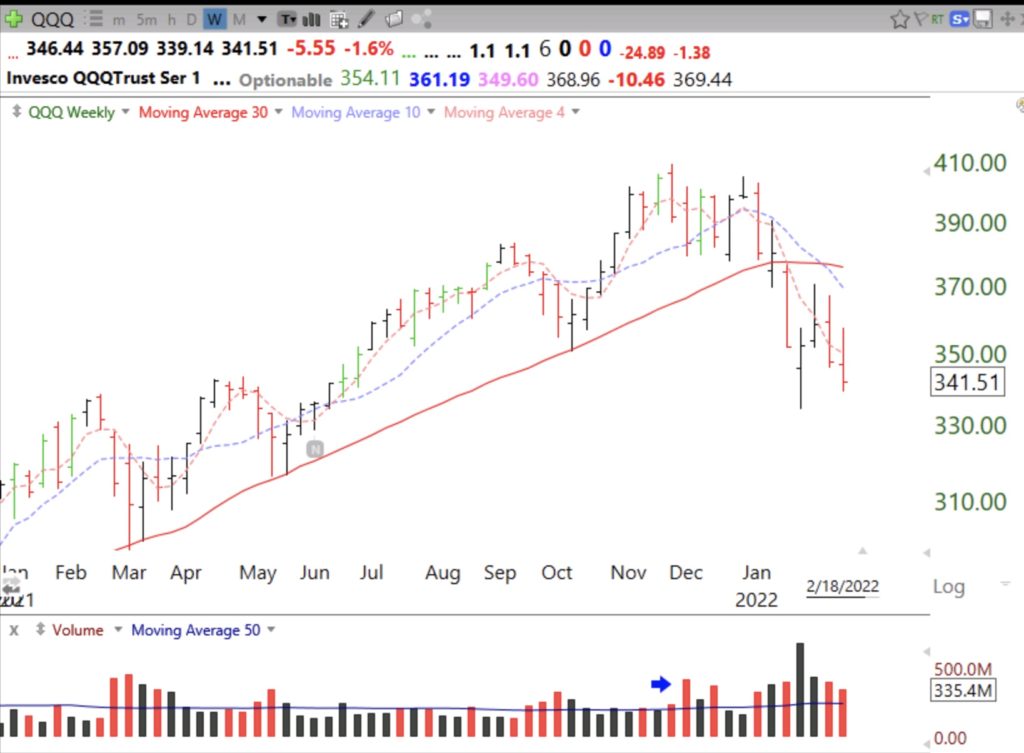
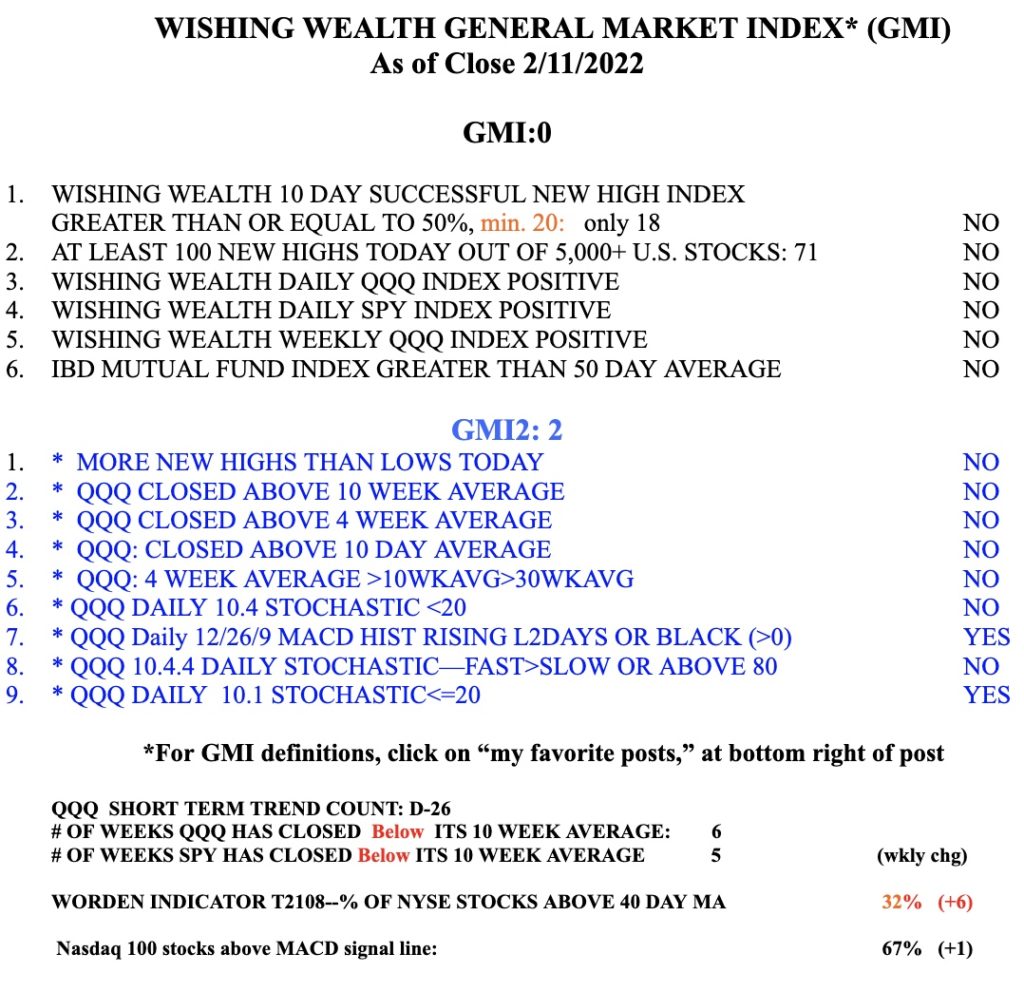
The GMI remains Red and I am mainly in cash. The new market leaders will show up in the new high list. Think about it. Any stock trading near an all-time high (ATH) after a significant market decline is one that is likely being accumulated. Stocks that fell a lot will have to overcome selling as they try to advance as persons who rode it down and have losses try to sell out. A stock that can overcome such selling and reach an ATH is demonstrating strong buying interest. I often run a scan on TC2000 that shows me any stock in my IBD/MarketSmith watchlist that was close to its ATH in the past week and that has a strong technical pattern evidenced in several weekly indicators. The scan found 15 out of 482 stocks this weekend. All retook their rising 4 week averages last week. Oil and gas and agriculture stocks predominate. The stocks appear below along with their next earnings dates and closing prices. These stocks are worth researching and monitoring for one’s favorite entry set-up. But in a market down-trend, it is critical to use small positions and tight sell stops on any purchase, or even better to stay on the sidelines in cash.
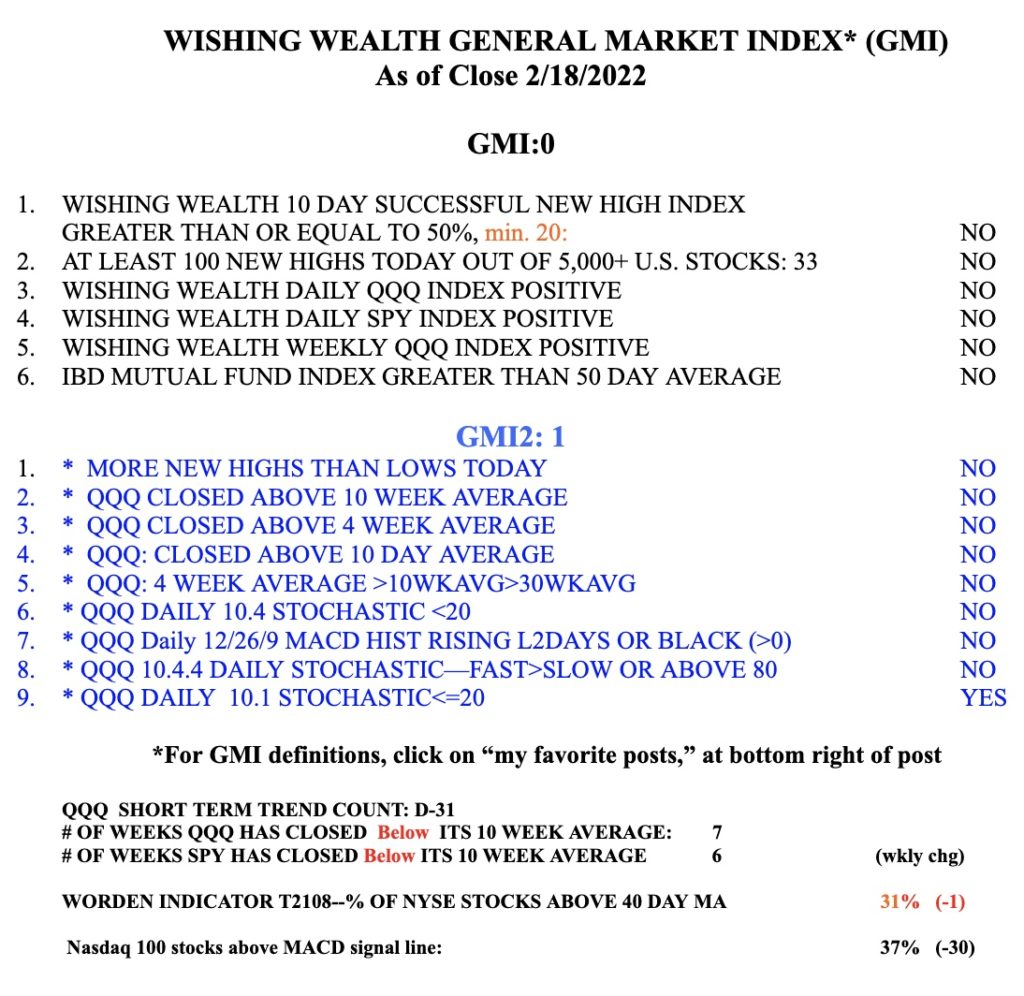
The GMI is still at 0 and Red. It is too early for me to go back in. T2108 never reached single digits. However, note that another contrarian indicator, the Investor’s Intelligence poll of newsletters, shows almost as many bears as bulls, which is extremely rare and typically occurs near market bottoms. There were more bears than bulls at the bottom in 2020.
