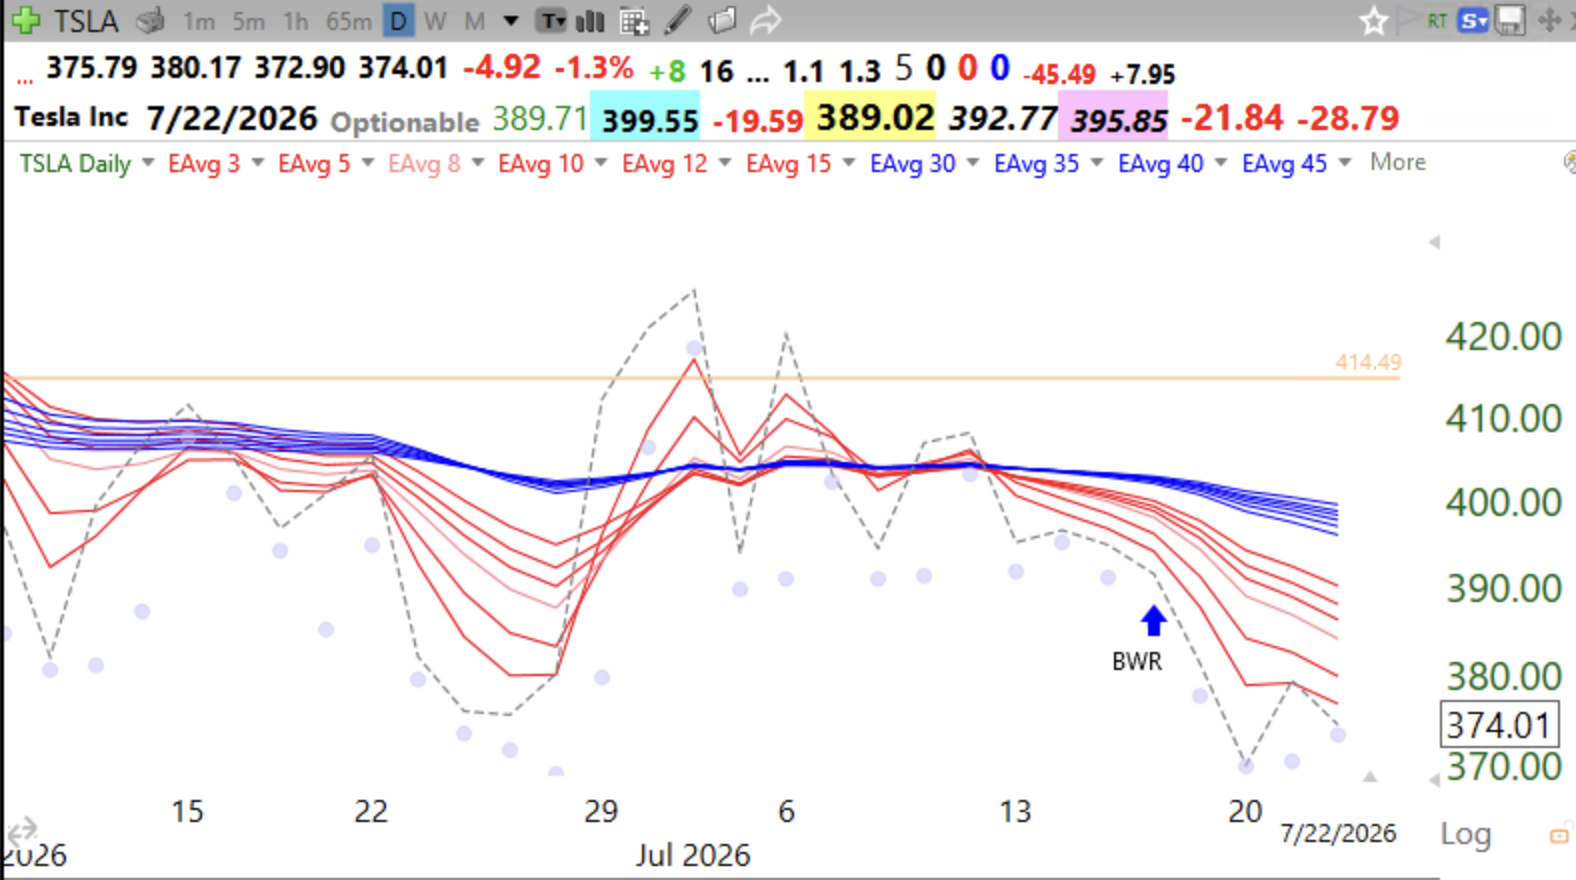
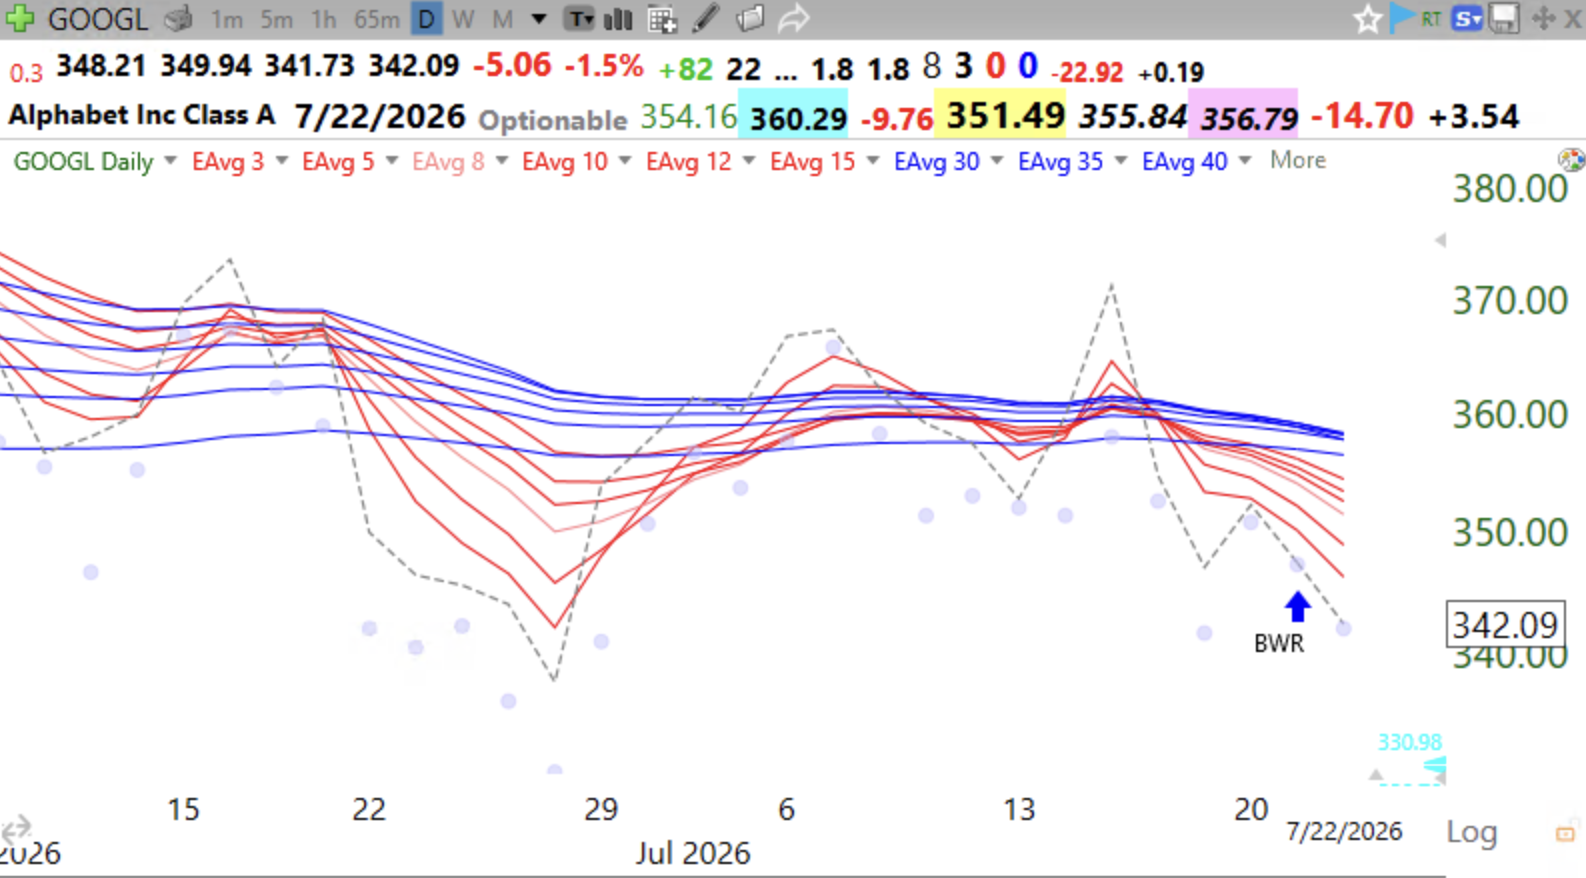
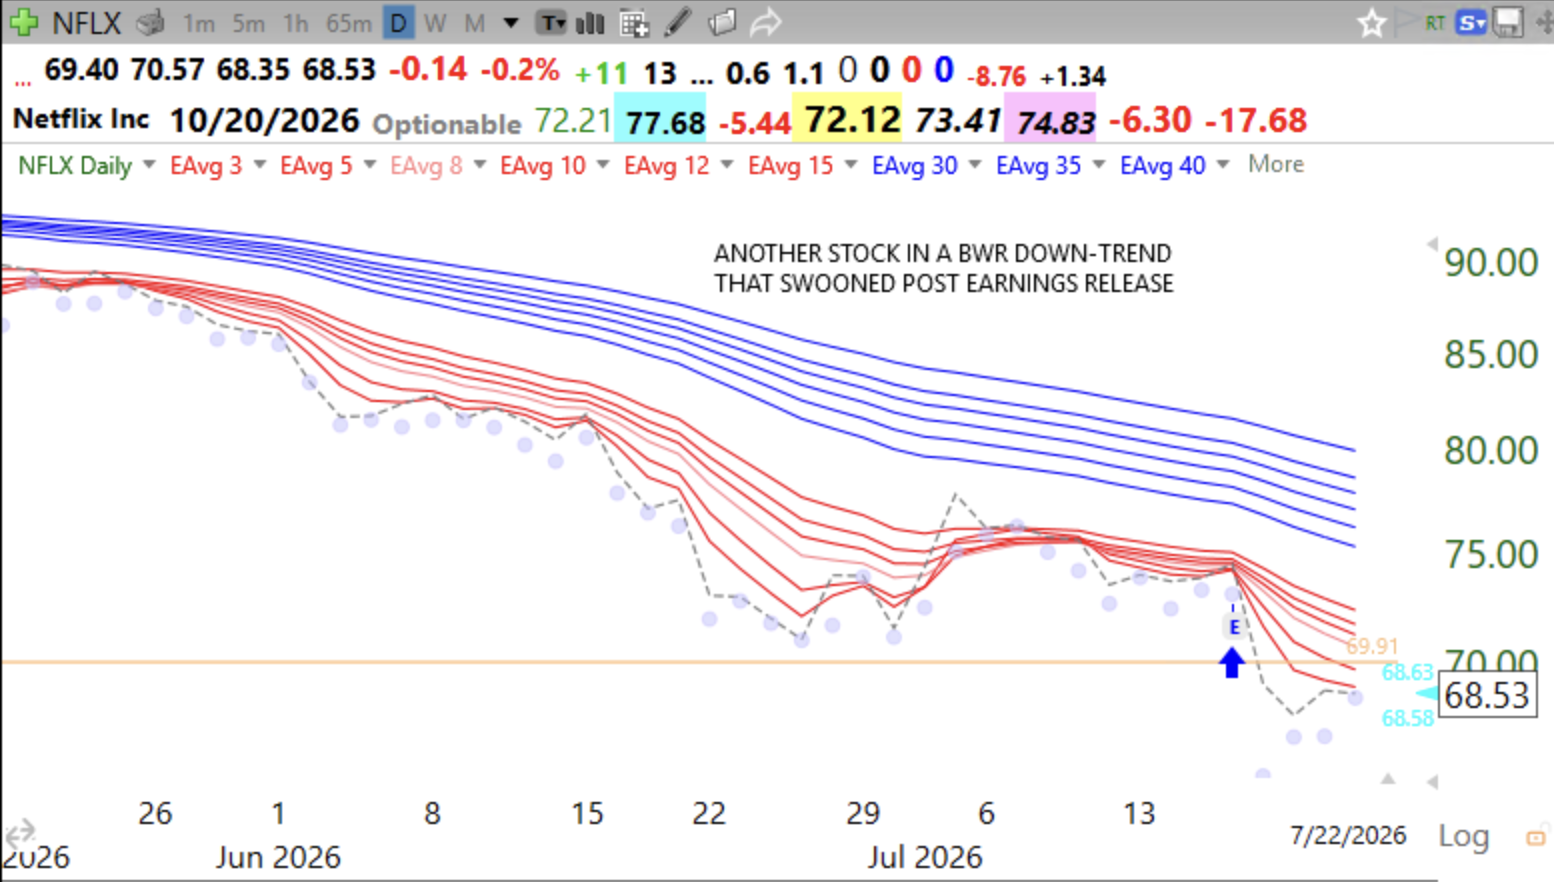
Blog Post: Day 81 of $QQQ short term up-trend, it may end Thursday; Mainly in cash during the post-earnings release lull; Many stocks had an oversold bounce on Tuesday, see $PLTR as an example.

GMI5/6
GMI-23/9
T210851%

Have you noticed that when earnings are released, stocks often have large moves up or down. After the earnings report period, stocks tend to settle down until the the next quarter’s earnings begin again. August and September tend to be weak months in the market. I expect at the end of the current quarter, around October, we could see the end of market weakness. Remember the maxim, Sell in May And Go Away And Come Back at Halloween. We have seen some rapid selling in the leaders. It is possible that the QQQ short term up-trend will end on Thursday, after 81 days. This is one of the longer QQQ short term up-trends I have seen. So it is not unexpected that it could end soon. But the end of a short term up-trend does not necessarily mean a large decline is coming. Almost half of new short term down-trends end within 5 days. So, I wait, mainly in cash, to see how this will all play out. I try not to marry a scenario. I just respond to the market’s actions and signals. I can reverse on a dime.

Many stocks bounced up off of their lower 15.2 Bollinger Bands on Wednesday (PLTR, AGX, FIX, IBKR, RMBS, to name a few). Tomorrow will tell if these bounces hold. Look at this chart of PLTR, as an example. The arrows show three prior such bounces. Note that each time the stock closed near its daily high on the day of the bounce. Will this bounce hold? We will know tomorrow. If the QQQ short term up-trend ends Thursday, I suspect many of these bounces will fail. I did not play this bounce. But if I had nibbled at PLTR today, I would have placed a stop loss just below the day’s low. Note the blue dot signals at each bounce. I explained the Blue Dot of Happiness indicator during my recent TraderLion Conference speech.

Screenshot


Blog Post: Day 44 of $QQQ short term up-trend; TA works also for mutual funds; See GLB last week in Fidelity Contrafund, $FCNKX, and learn how I analyze the market and a great source to limit losses.

GMI6/6
GMI-27/9
T210860%

My university retirement accounts only let me invest in mutual funds, one of which is Fidelity Contrafund. That fund is one of the best performing funds in strong growth stock markets. When one of my scans detects a stock, I am more likely to buy it if Fidelity Contrafund has invested in it. The charts below show how well the fund has done in the past. The weekly chart shows the GLB.

Screenshot

I have found in this 10:30 weekly chart that when the 10 week average (dotted line) closes above the 30 week average (solid red) it can signal a major up-trend. The reverse is true.  The recent changes in trend are shown by the red and green arrows. The gray line shows the weekly close, which, of course, leads the averages.

Screenshot

The monthly chart shows this fund’s performance since its inception.

According to Morningstar, a $10,000 investment made in the fund in 2015 is now worth $46,586. Contrafund is so popular that it is often times closed to new investors. After the recent market decline, it may now be open to new investors?

Just as Contrafund has now had its 10 week average cross above the 30 week, the same is true of $SPY and $QQQ. $QQQ’s signal is noted near the bottom of my GMI table below. I have been slowly transferring cash from money market funds to mutual funds and stocks.

My modified weekly Guppy chart below  shows that QQQ is also back to a weekly RWB up-trend. With the GMI= 6 (of 6), I think the odds are great for me to trade long. I am gradually investing long again. I focus on the market’s movement and ignore the news and mental masturbation of the many media pundits. I believe I heard Steve Forbes once say that his father told him that it is far easier to make money selling advice than by trading. No one can reliably predict in advance what the market will do, except occasionally, by luck or chance. I watch my indicators and ALWAYS limit my losses. That is the way to survive in the market. I have been trading or investing for over 60 years. One of the best ways to learn how to limit losses is described in a chapter in the recently published book, the Trader’s Handbook. My former student, Richard Moglen, is the first author. (I wrote the foreword and receive no compensation other than a sample copy.)

Screenshot
Screenshot


Blog Post: Day 8 of $QQQ short term up-trend; $BJ had another successful Blue Dot set-up, as did $GLD, see daily charts.

GMI4/6
GMI-25/9
T210845%

I will explain the Blue Dot set-up during my presentation to the Boston IBD Meetup on 5/21, registration link to come. I am retiring from teaching at the university. My former extraordinary student, Richard Moglen,  and I are planning to offer my course on line in the fall through TraderLion! Stay tuned.

Screenshot
Screenshot