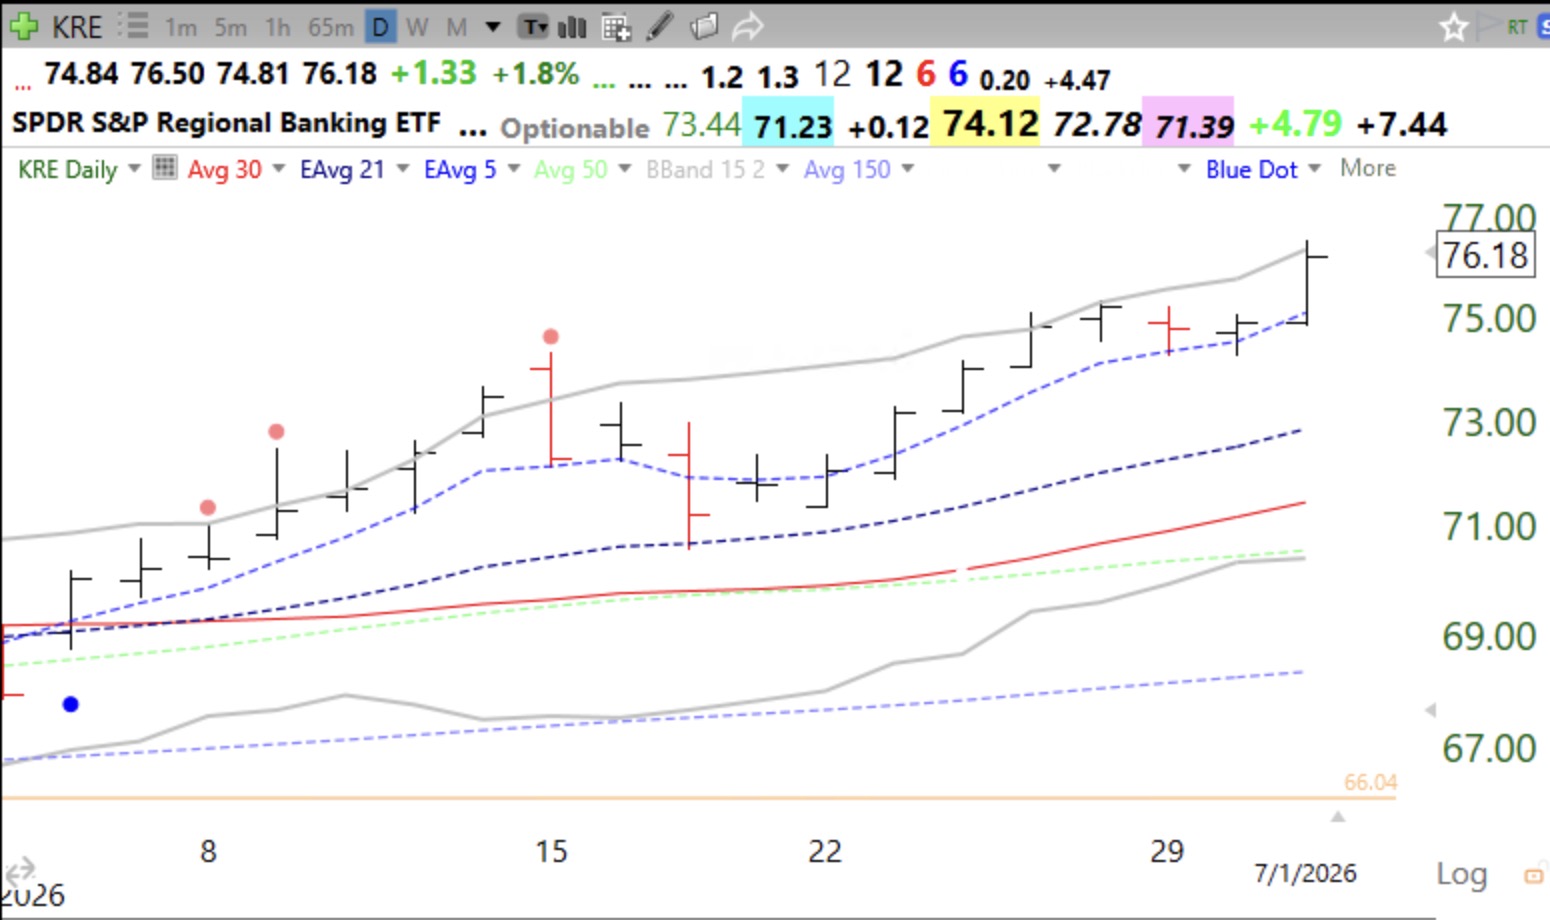
Blog: Of the 146 stocks at ATHs on Wednesday, more than one half were banks! 376 US stocks hit 52 week highs, the most since February 6! See daily chart of Regional Banking ETF.
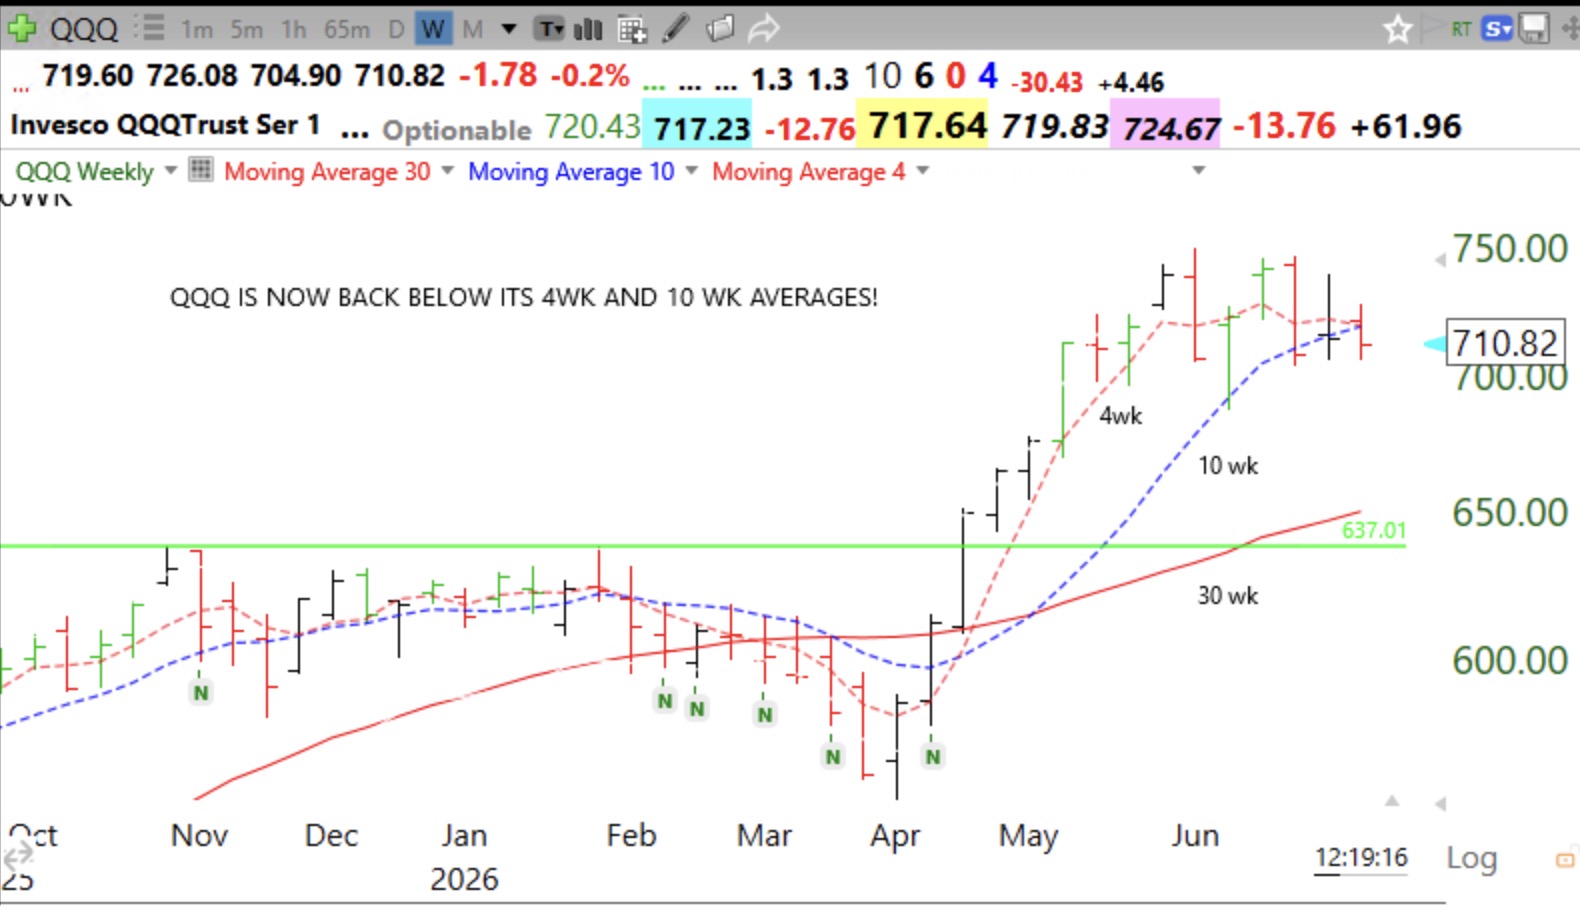
Maybe interest rates are going higher? More money for banks? Today was Day 2 of the new QQQ short term up-trend. I do not know if it will last with the turn away from tech stocks. Happy and safe 4th!