Check out this daily chart of $NVAX:
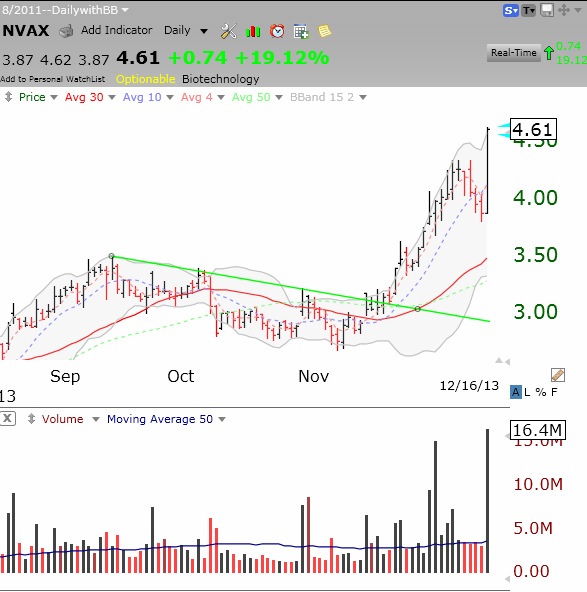 It rose on highest daily volume ever.
Share this:
- Click to email a link to a friend (Opens in new window) Email
- Click to share on Facebook (Opens in new window) Facebook
- Click to share on X (Opens in new window) X
- Click to share on LinkedIn (Opens in new window) LinkedIn
- Click to print (Opens in new window) Print
- More
- Click to share on Pocket (Opens in new window) Pocket
- Click to share on Pinterest (Opens in new window) Pinterest
- Click to share on Tumblr (Opens in new window) Tumblr
- Click to share on Reddit (Opens in new window) Reddit
- Click to share on Telegram (Opens in new window) Telegram
- Click to share on WhatsApp (Opens in new window) WhatsApp
Congratulations on NVAX.
In an effort to improve my TC2000 skills, I sometimes track your GMI-2 indicators with my readings. Apparently, I misread an indicator on Monday. I show 3, 4, 7 and 8 as NO, which is a reading of 4 versus your 5. Which of these four indicators should have been a YES?
I believe it is either 3 or 4. I use a simple moving average for 3 (4 week average: 85.47 > 85.32 close) and 4 (10 day average: 85.52 > 85.32 close). Do you use a different type of moving average? I’m trying to understand where I was off in my readings. Thanks in advance for your help.
Rick, I did not keep a record of the ma’s and cannot go back.