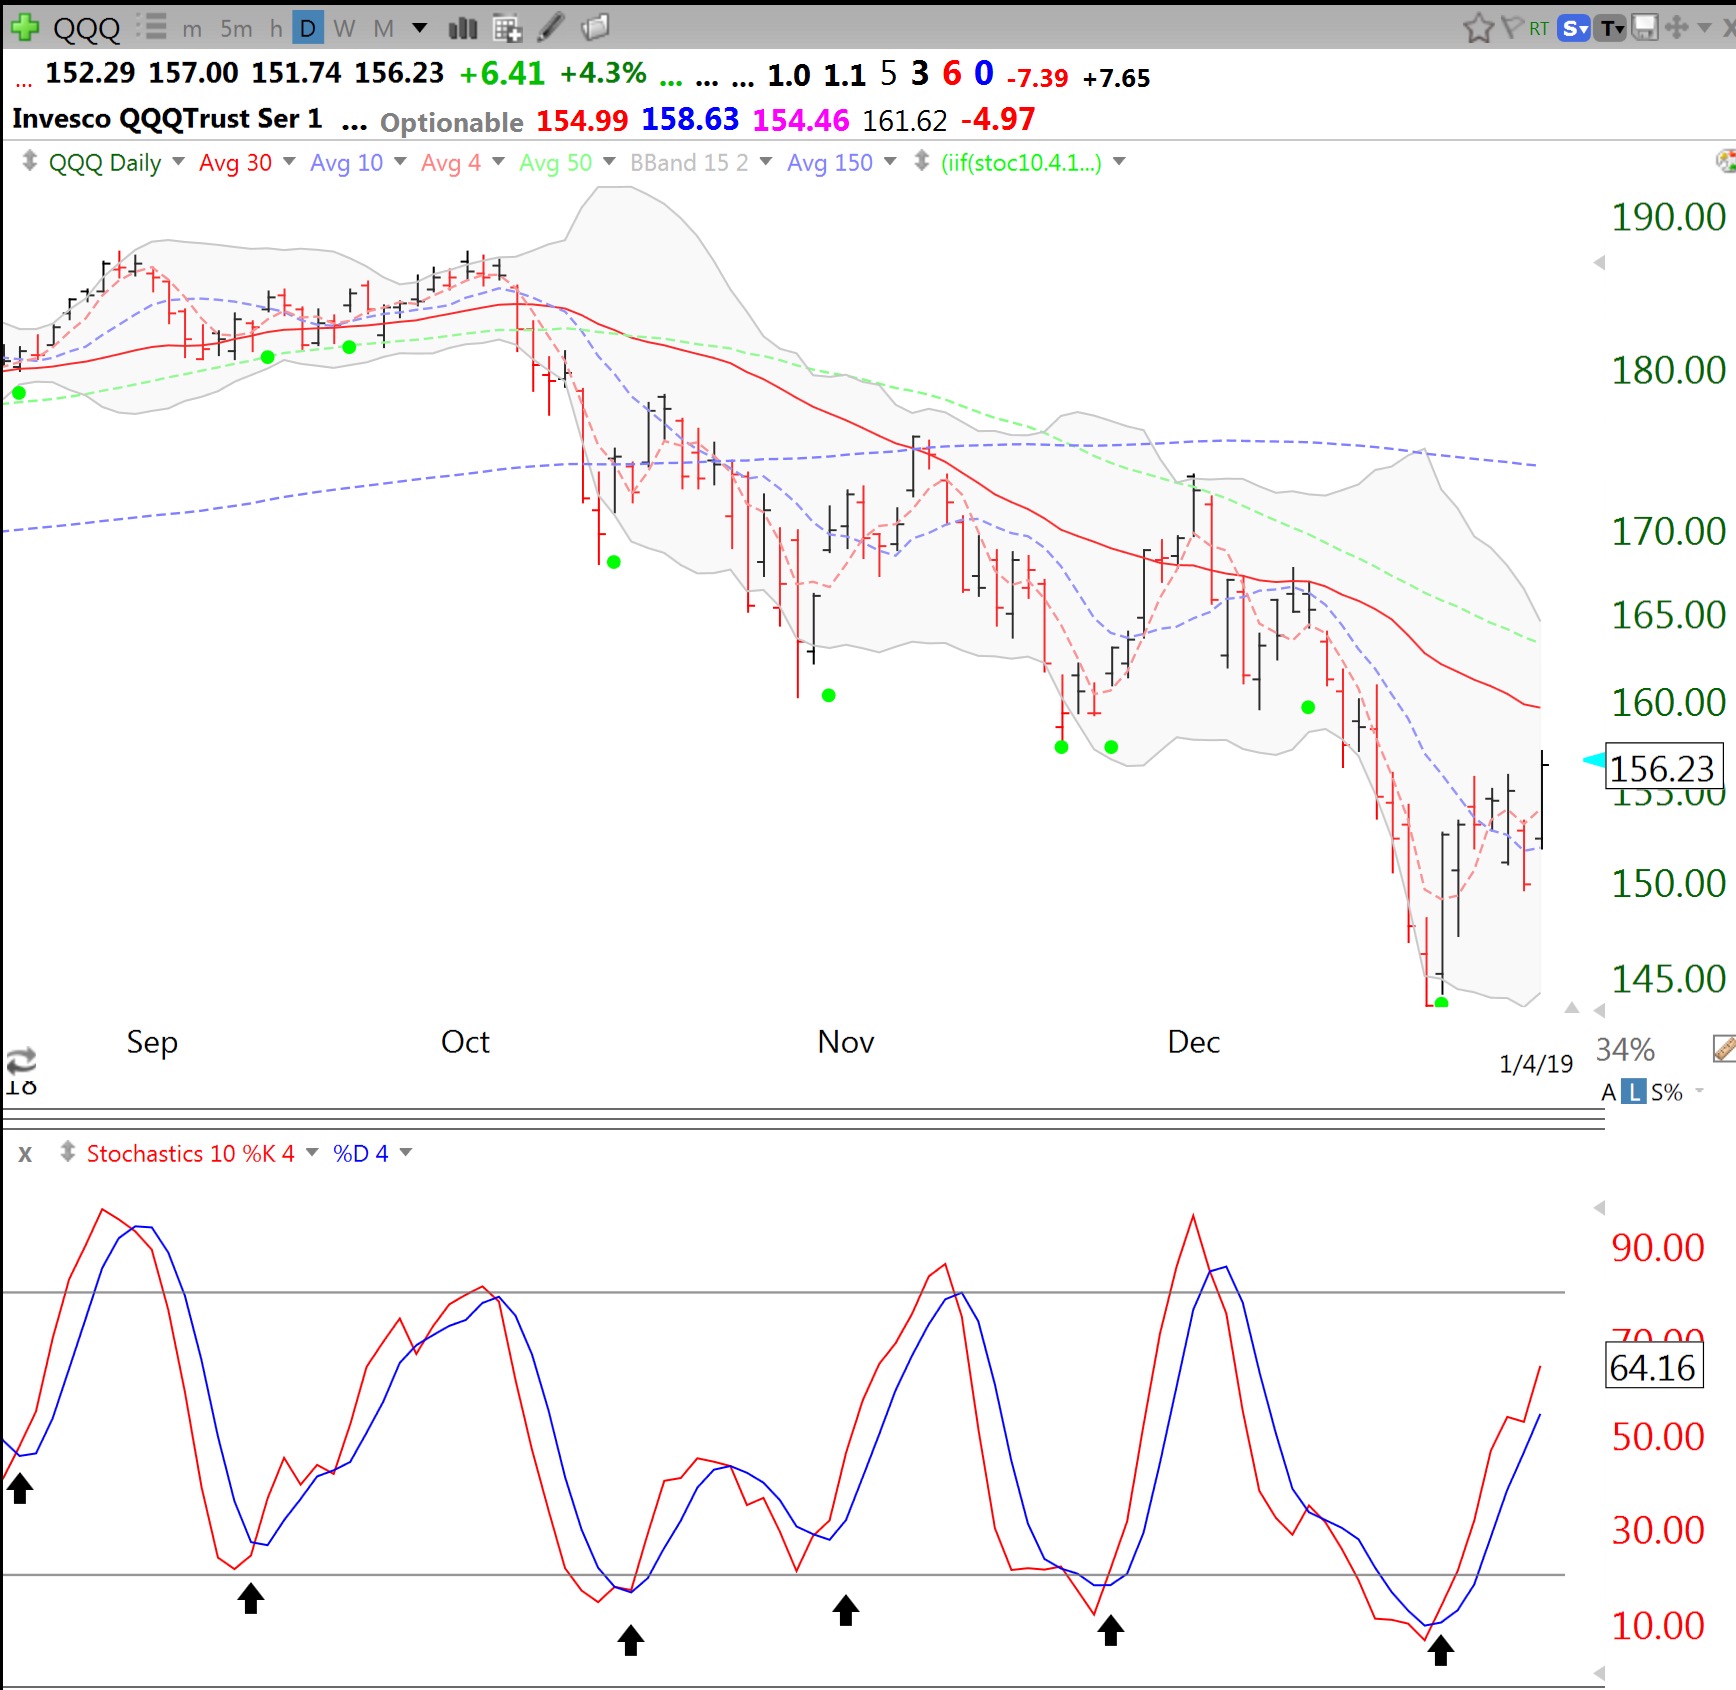
You can learn about the green dot indicator in my prior posts. It is a daily 10.4 stochastic cross and indicated by a green dot on the price chart and the arrow on the stochastic chart below. When a stock or index ETF is in a sustained up-trend (QQQ is not) buying on the green dot signal often works for me. During a down-trend one can sometimes also get a tradable bounce. You can access at my TC2000 Club a video showing how to add the green dots to the price chart.
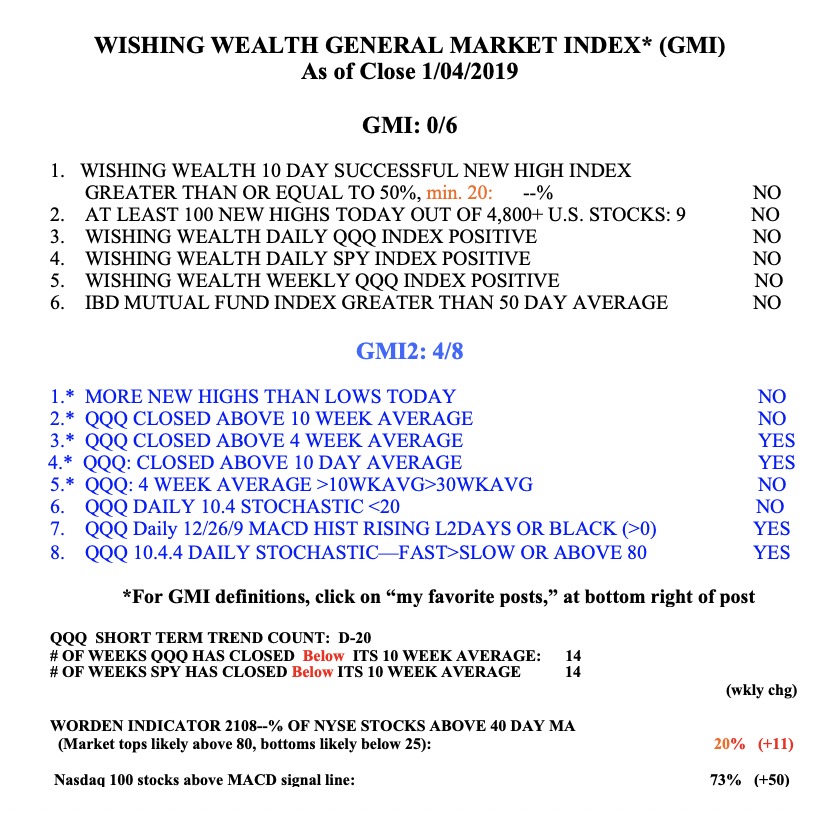
The GMI remains at 0 (of 6) and on a Red signal.
looks like a red dot useful for short trades (ie > 70 cross)
I do not find the selling/shorting an overbought stochastic signal as reliable as buying an oversold one.
Wow, Your content is Really Amazing & Useful, Its really motivate us. People are so much inspired by your content. Please keep making these kind of amazing content always. We always look forward for these contents by your team. You can also feedback on
Forex Trading For Beginners