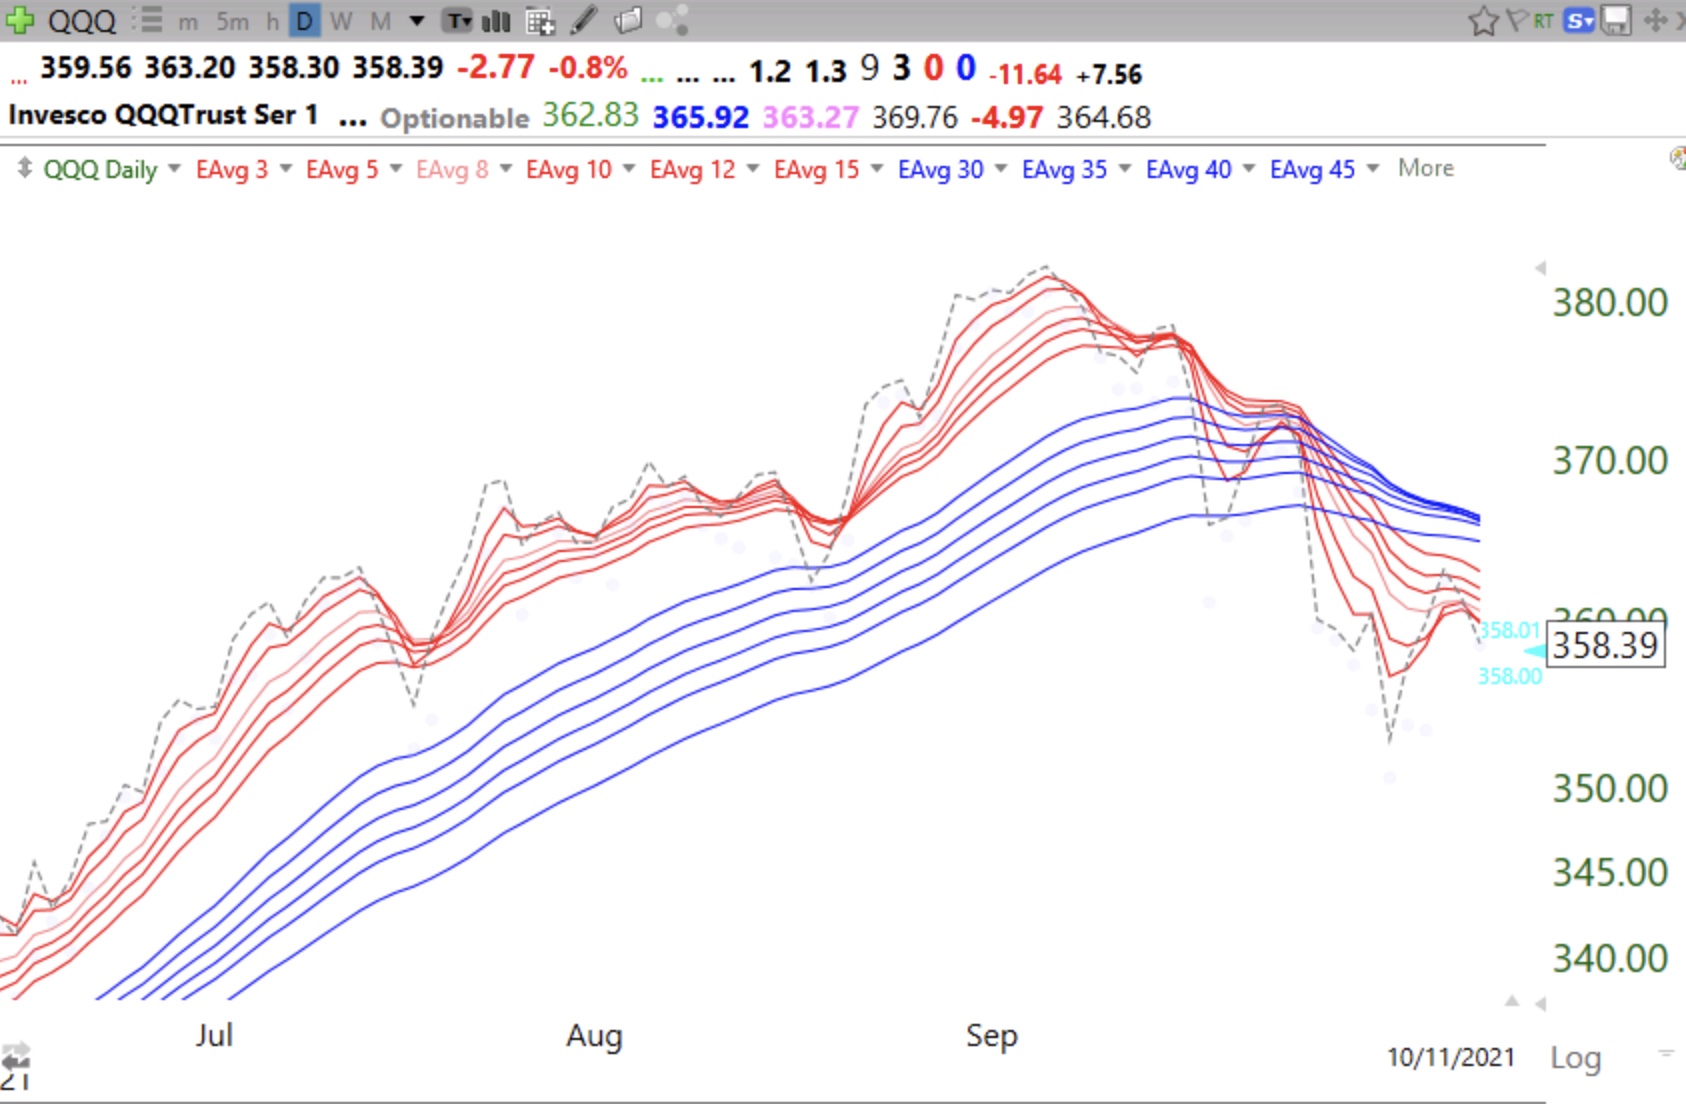
Notice all short term averages (red) are declining below the longer term averages (blue), hence BWR pattern.
Share this:
- Click to email a link to a friend (Opens in new window) Email
- Click to share on Facebook (Opens in new window) Facebook
- Click to share on X (Opens in new window) X
- Click to share on LinkedIn (Opens in new window) LinkedIn
- Click to print (Opens in new window) Print
- More
- Click to share on Pocket (Opens in new window) Pocket
- Click to share on Pinterest (Opens in new window) Pinterest
- Click to share on Tumblr (Opens in new window) Tumblr
- Click to share on Reddit (Opens in new window) Reddit
- Click to share on Telegram (Opens in new window) Telegram
- Click to share on WhatsApp (Opens in new window) WhatsApp
Love your work Dr. Can you tell me where I can find the indicators for black dots and green dots. Or point me to an article. Have looked and cannot find it! Thanks for all your great work
Do you want TC2000 PCFs?