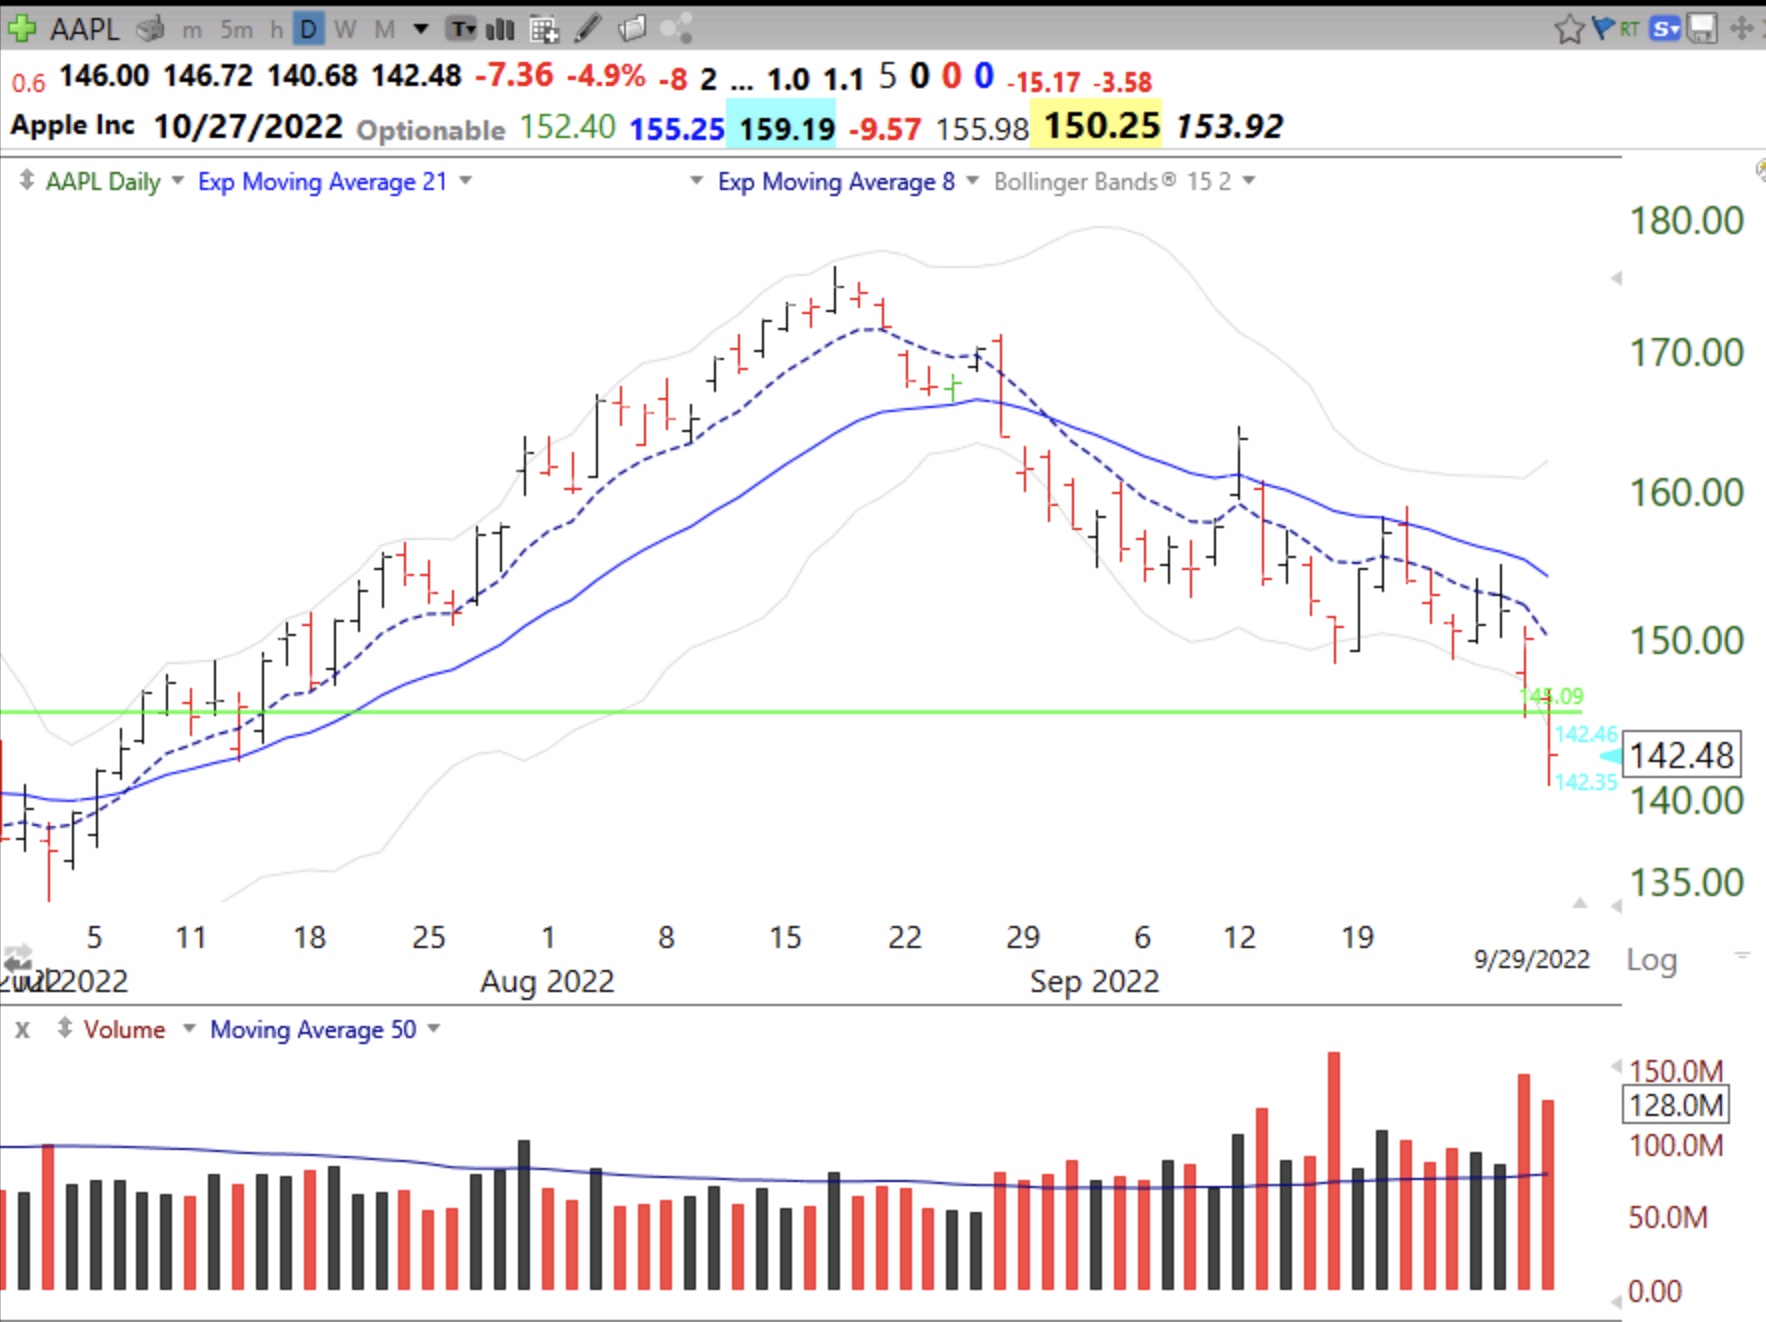
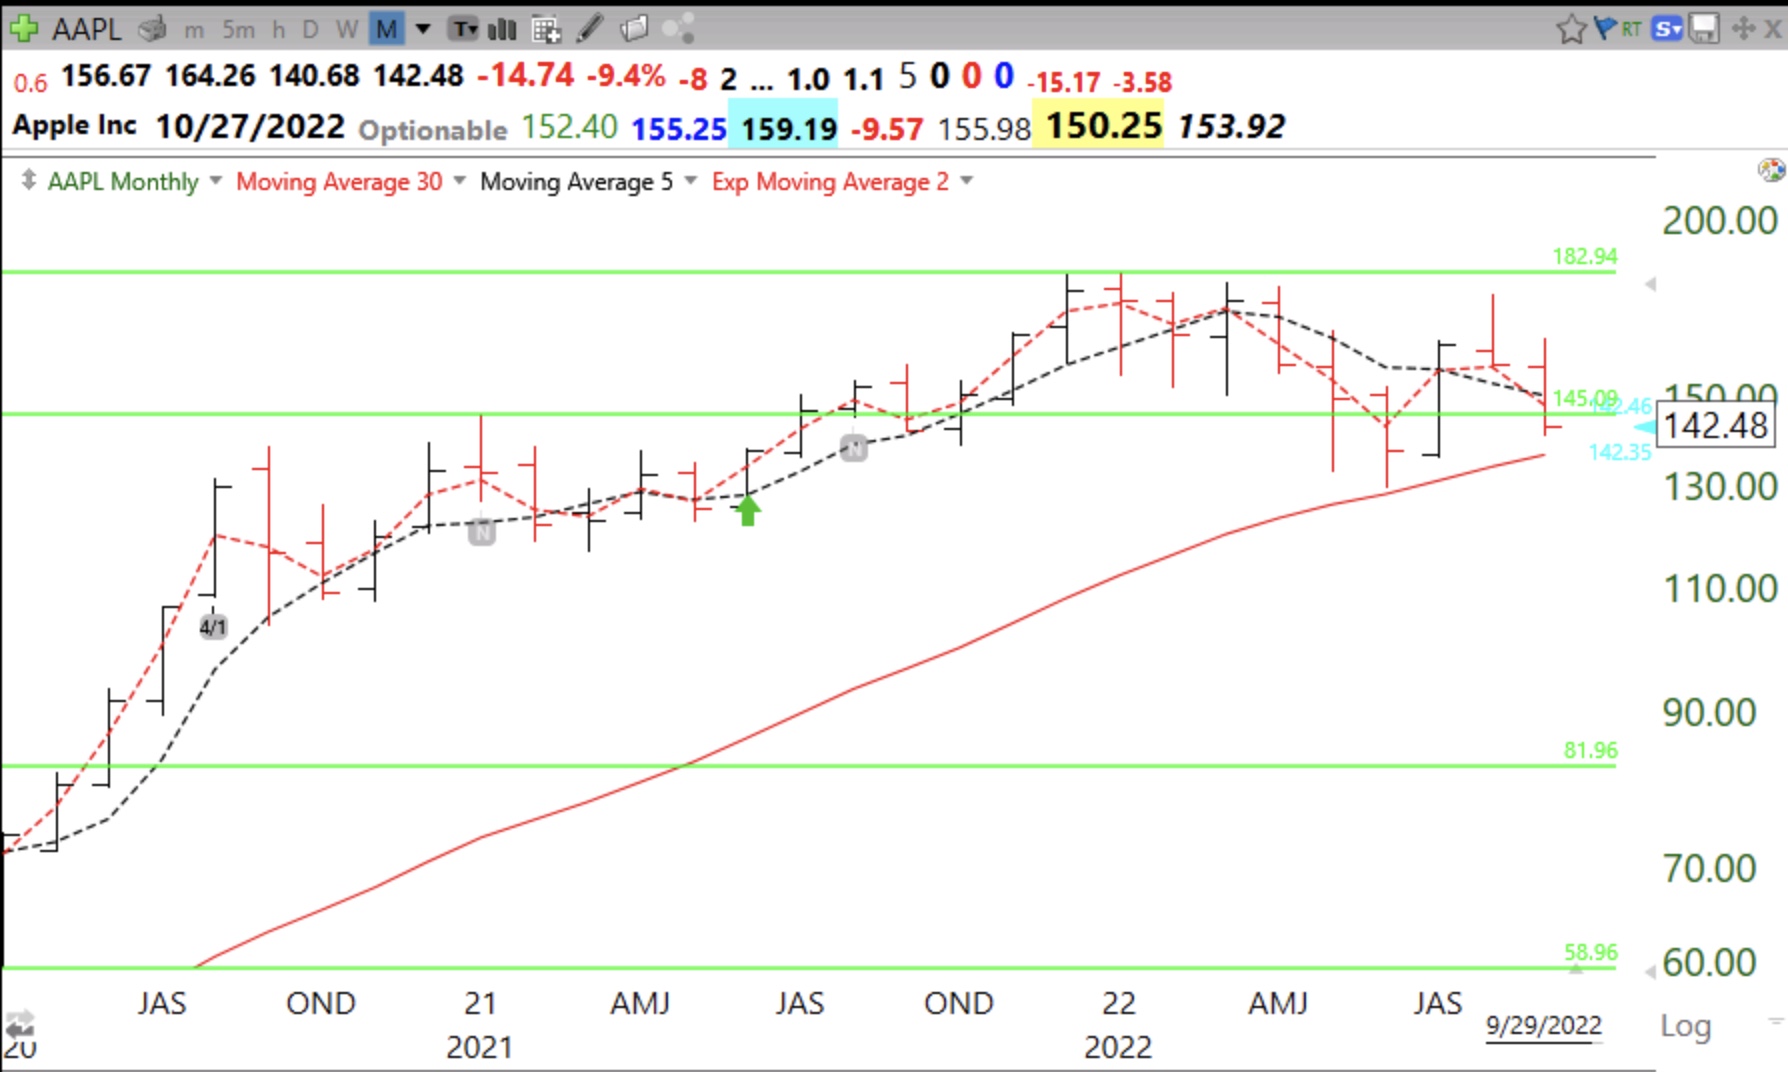
AAPL closed below its last green line break-out (GLB) top. Note the above average volume.
Monthly chart.
Share this:
- Click to email a link to a friend (Opens in new window) Email
- Click to share on Facebook (Opens in new window) Facebook
- Click to share on X (Opens in new window) X
- Click to share on LinkedIn (Opens in new window) LinkedIn
- Click to print (Opens in new window) Print
- More
- Click to share on Pocket (Opens in new window) Pocket
- Click to share on Pinterest (Opens in new window) Pinterest
- Click to share on Tumblr (Opens in new window) Tumblr
- Click to share on Reddit (Opens in new window) Reddit
- Click to share on Telegram (Opens in new window) Telegram
- Click to share on WhatsApp (Opens in new window) WhatsApp
Do you draw those green lines, or is there a formula in TC200 that you use, Dr Wish? I am new to your blog having watched your TraderLion session recently. C
I use TC2000 to find stocks with a new price high (built in condition) the past few weeks and then manually draw in the green lines. There is no automatic way to draw them and I find it useful to review them manually.